
The Profit Your Sprint Plan Already Spent
Your Plan Failed Before the Sprint Started (Profit With Proof | Episode 7)

The Ghost Capacity Trap
Your resourcing model says you have time. Your engineers know otherwise.
👋 Welcome to this week’s edition of Empathy Engine. Every Wednesday (formerly Tuesday), I publish a new article for paid subscribers first, then unlock the full piece for everyone late Thursday morning. Each week, I turn product leadership friction into practical tools, sharper language, and more defensible decisions.
Previous article in this series: Episode 6 (A Meeting Killed Your Profits)

I have watched a resourcing spreadsheet turn a drowning team into a neat green row while the “20% available” column quietly ignored support rotation, code review, production noise, and the one senior engineer every urgent question somehow found first. Everyone could see the number was wrong, but nobody wanted to be the first person to make the meeting uncomfortable.
A resourcing manager prepares a capacity plan for the next quarter. Four engineering teams. 80% allocated. 20% available for new work. The spreadsheet looks responsible. The numbers are clean. Three engineering leads review the plan and ask the same question: “available to whom?”
The 20% represents time that exists on paper between scheduled deliverables. It does not account for context switching costs, interrupt-driven support requests, code review obligations, documentation debt, or the undocumented work that fills every gap the plan does not acknowledge. The capacity is real in the spreadsheet. It is ghost capacity in the building.
That is the Ghost Capacity Trap!
The plan looked clean because the system only counts the work that made it onto the board. Here is what happens to that plan by Wednesday.

The Rework Tax priced work paid for twice. The Escalation Delay Cost priced the silence between warning and owner. The Integration Penalty priced the workaround nobody removed. The Agile Meeting Burn Rate priced coordination that lost its return. Each of those costs was survivable. That is the trap. Ghost capacity is the operating condition that made every one of those costs absorbable long enough to ignore.
Research Binder: the receipts (citations + source notes) are compiled in a PDF at the bottom of this article.
What this article does and does not claim
Does: give you a defensible way to estimate your own ghost capacity exposure, and a diagnostic structure you can carry into a capacity planning conversation.
Does not: claim a universal benchmark for invisible work, guaranteed capacity recovery, or a specific percentage that applies to your team without measurement.
If you are skimming
Read three sections: You start the sprint with less than you think, The spreadsheet shows green, and What leaders should do next. The Capacity Reality Check sits between them as the operational payoff.
TL;DR
Ghost capacity is the gap between what the resourcing model says is available and what the team can actually direct to new work.
Most capacity models measure allocation, not availability. The gap between them is where burnout accumulates and delivery commitments quietly become unrealistic.
The system does not just fail to measure invisible work. It rewards absorbing it silently and punishes naming it openly.
The Capacity Reality Check turns that gap into a number your leadership team can challenge in a QBR.
You start the sprint with less than you think
Capacity planning feels reliable because the system produces a specific number. The number is clean. It reconciles with the headcount. It maps to the sprint. It looks like something you can commit against.
The number is also structurally incomplete.
The CISQ 2022 Cost of Poor Software Quality report, aggregated from 88 US public sources, estimates that roughly 33% of developer time is consumed by unplanned work and rework. For a 10-person team that appears to have 10 developer-days available, true starting capacity is closer to 6.7. The missing 3.3 developer-days are not a rounding error. They are a structural misread of reality that the plan never accounts for, because the plan was not designed to see work the system does not formally track.
When that missing capacity inevitably surfaces mid-sprint, it looks like disruption. It is not. It is a delayed reveal of time that was already spoken for before the sprint began.
Here is what the capacity plan reports.
Here is what the team actually starts with.
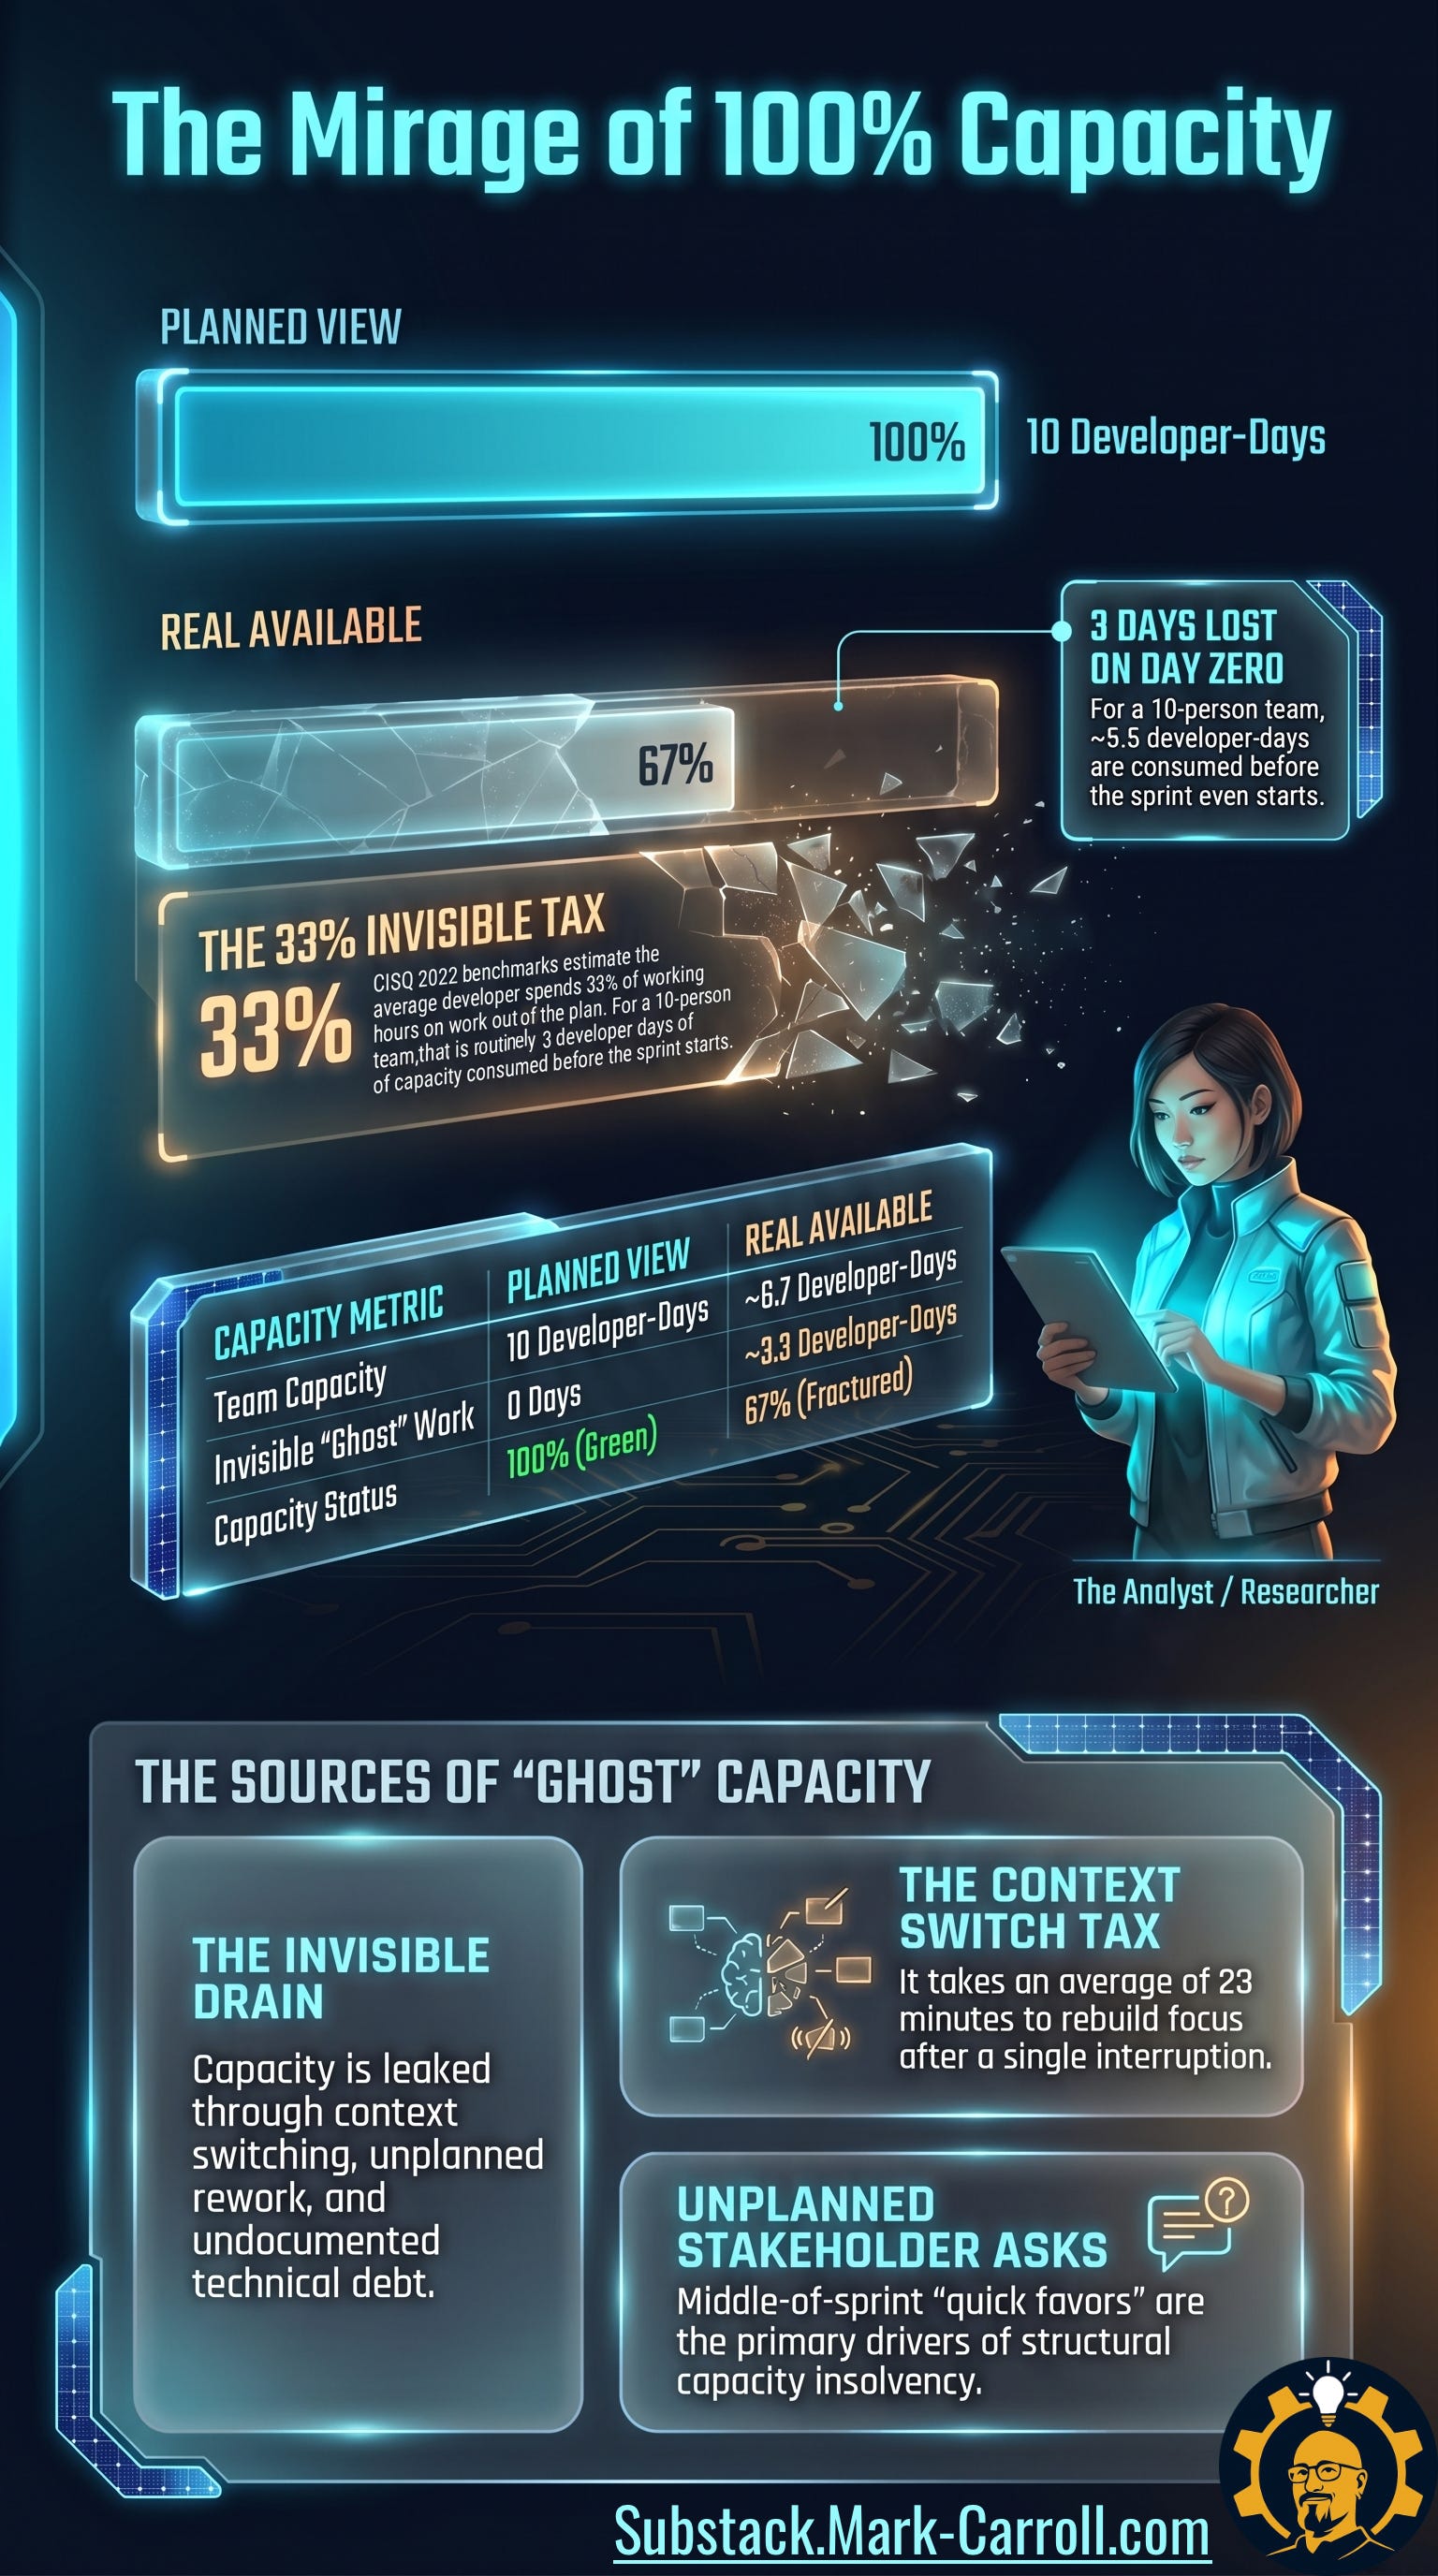
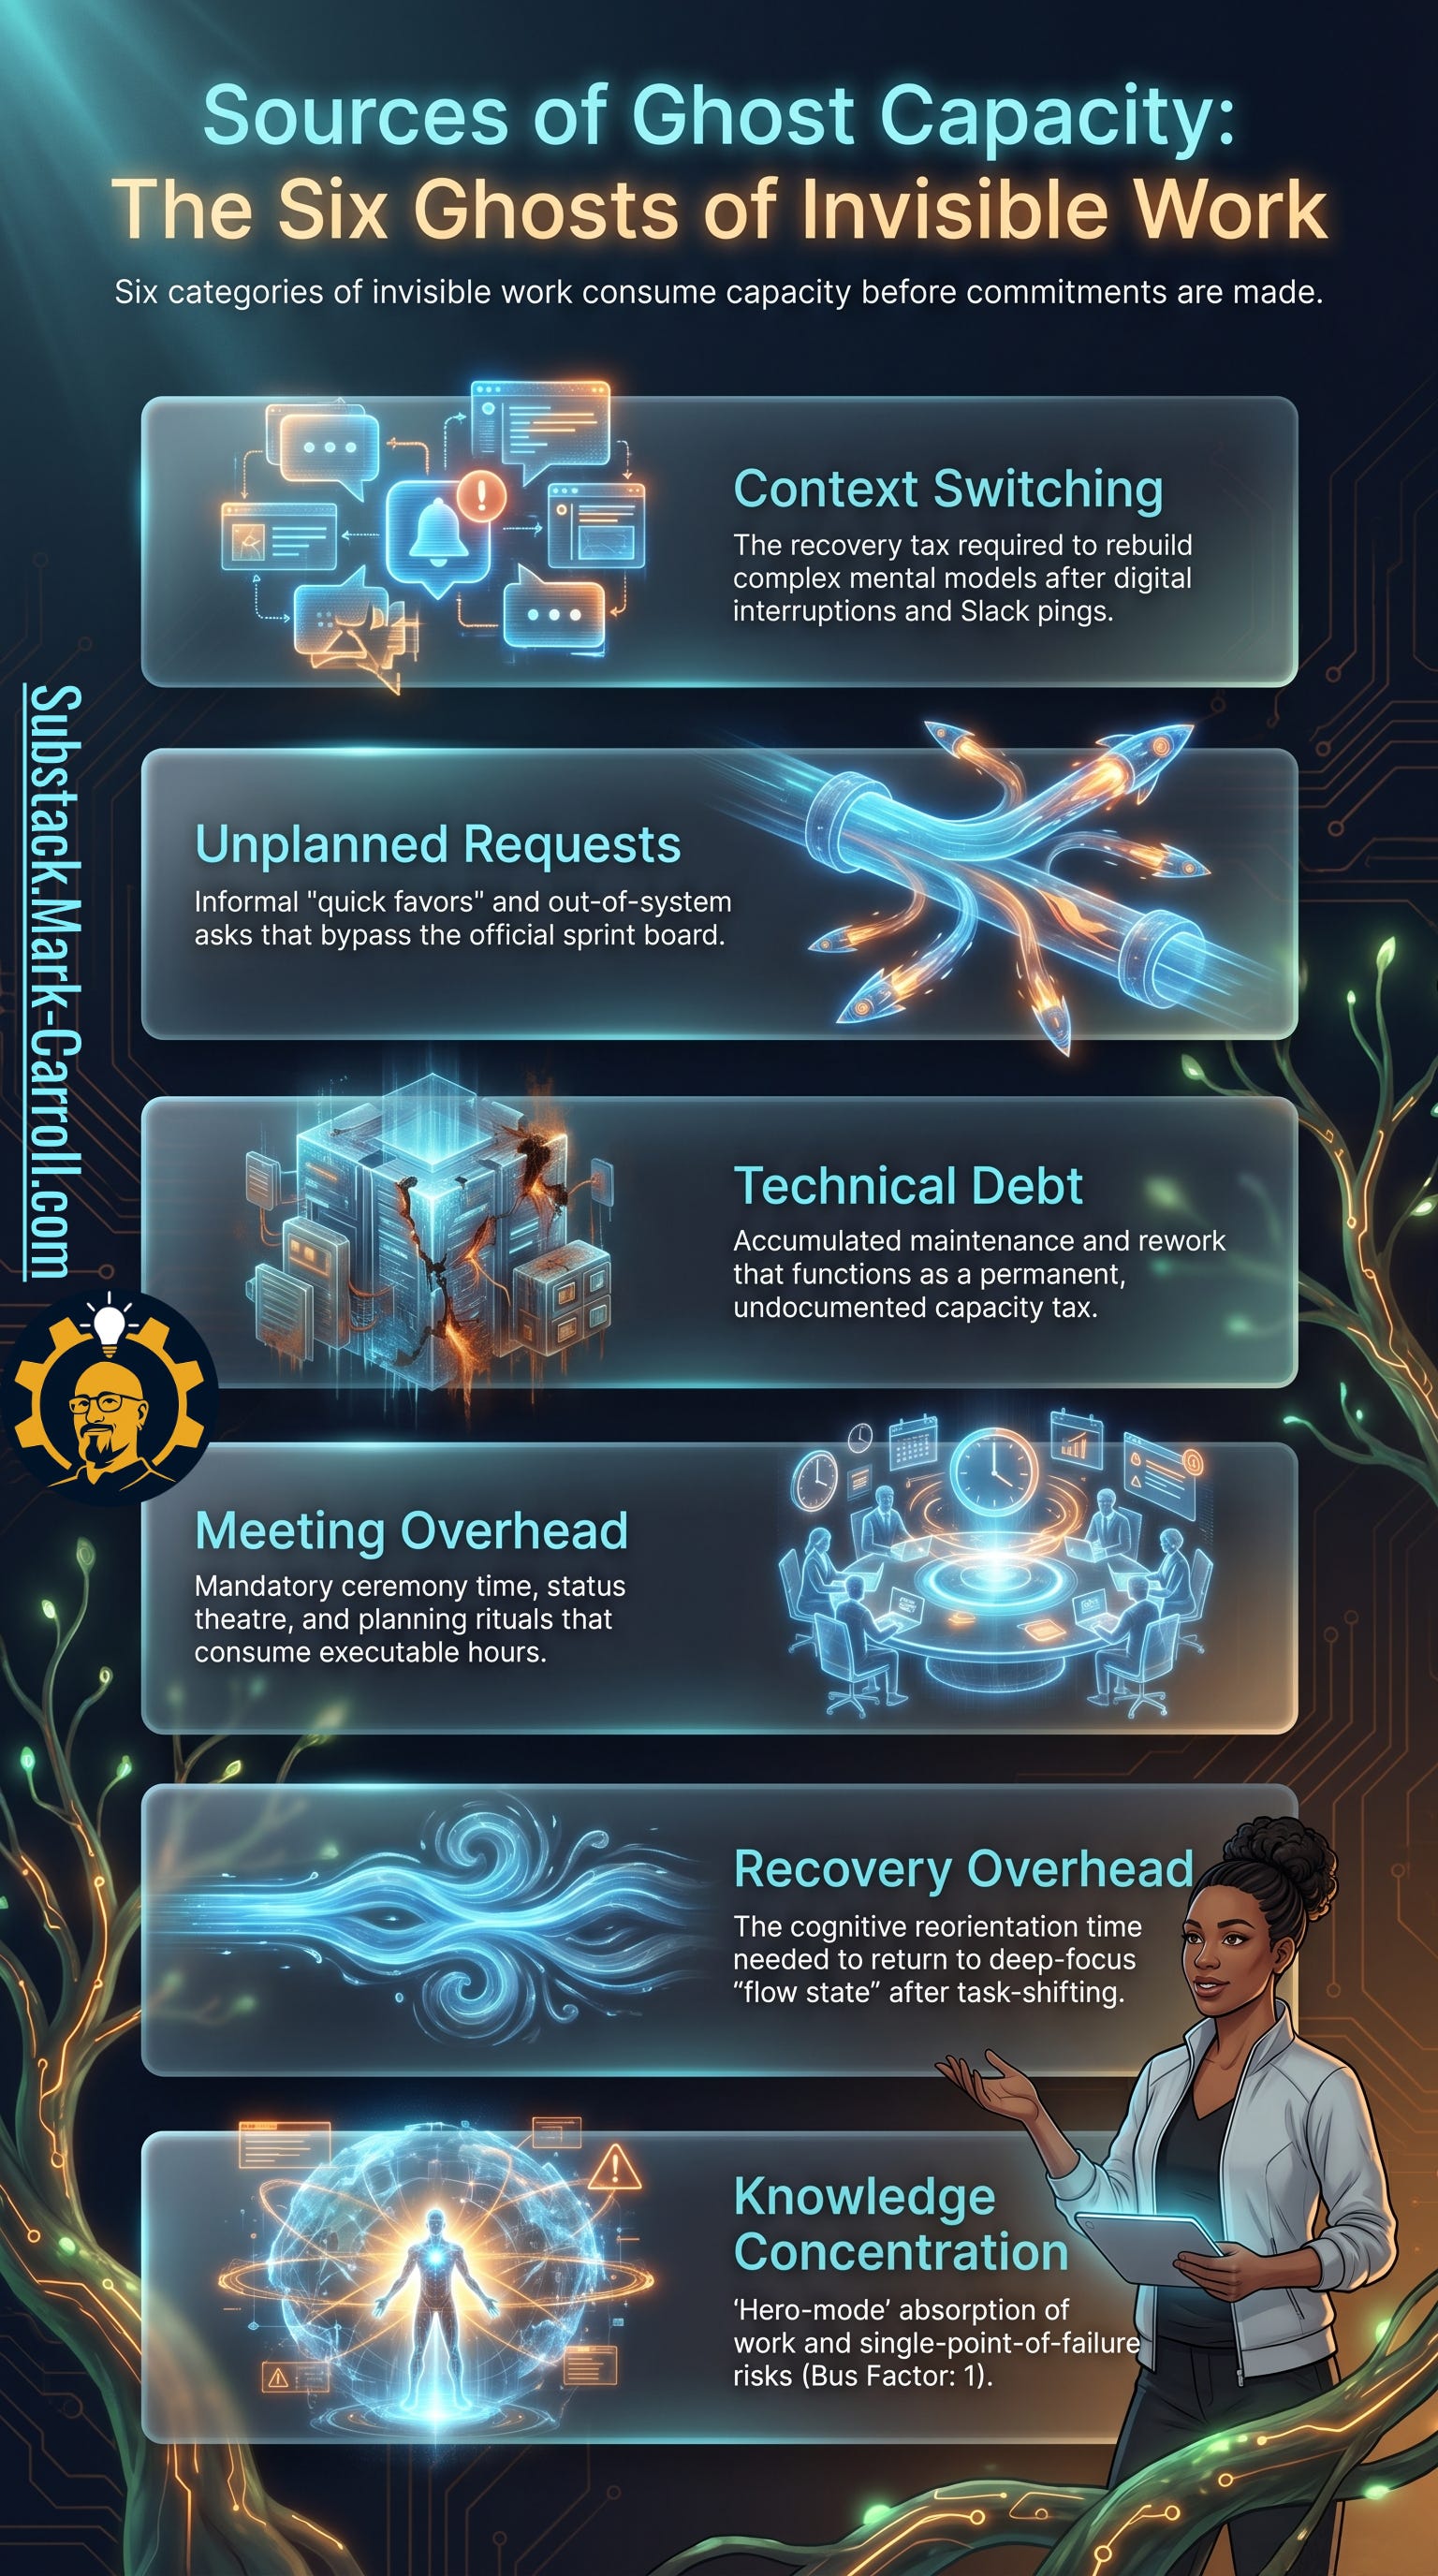
The missing 3.3 developer-days do not vanish randomly. They follow consistent, repeatable channels that show up across teams. Context switching imposes a recovery tax: each interruption costs an average of twenty-three minutes of cognitive reorientation before deep work resumes. Unplanned requests arrive through side channels (ie. Slack pings and “quick favors” that bypass the sprint board entirely). Technical debt accumulates as a permanent, undocumented capacity tax. Meeting overhead consumes executable hours. Recovery overhead compounds the cost of every interruption beyond its visible duration. Additionally, knowledge concentration routes critical decisions through one person, creating a single-point-of-failure that quietly absorbs capacity nobody budgeted. Yeah! It’s a lot.
The plan did not lie. It had no place to put the truth.
Six categories of invisible work consume capacity before commitments are made. None of them appear on the sprint board.
The system trains teams to overcommit
The most dangerous part is not the extra work. It is what the organization learns from watching the team survive it. When teams successfully “handle it,” the organization quietly updates its expectation of what that team can do. Over time, invisible effort becomes normalized capacity, and overcommitment stops looking like a problem and starts looking like performance.
When absorption looks like performance, the trap has already closed.
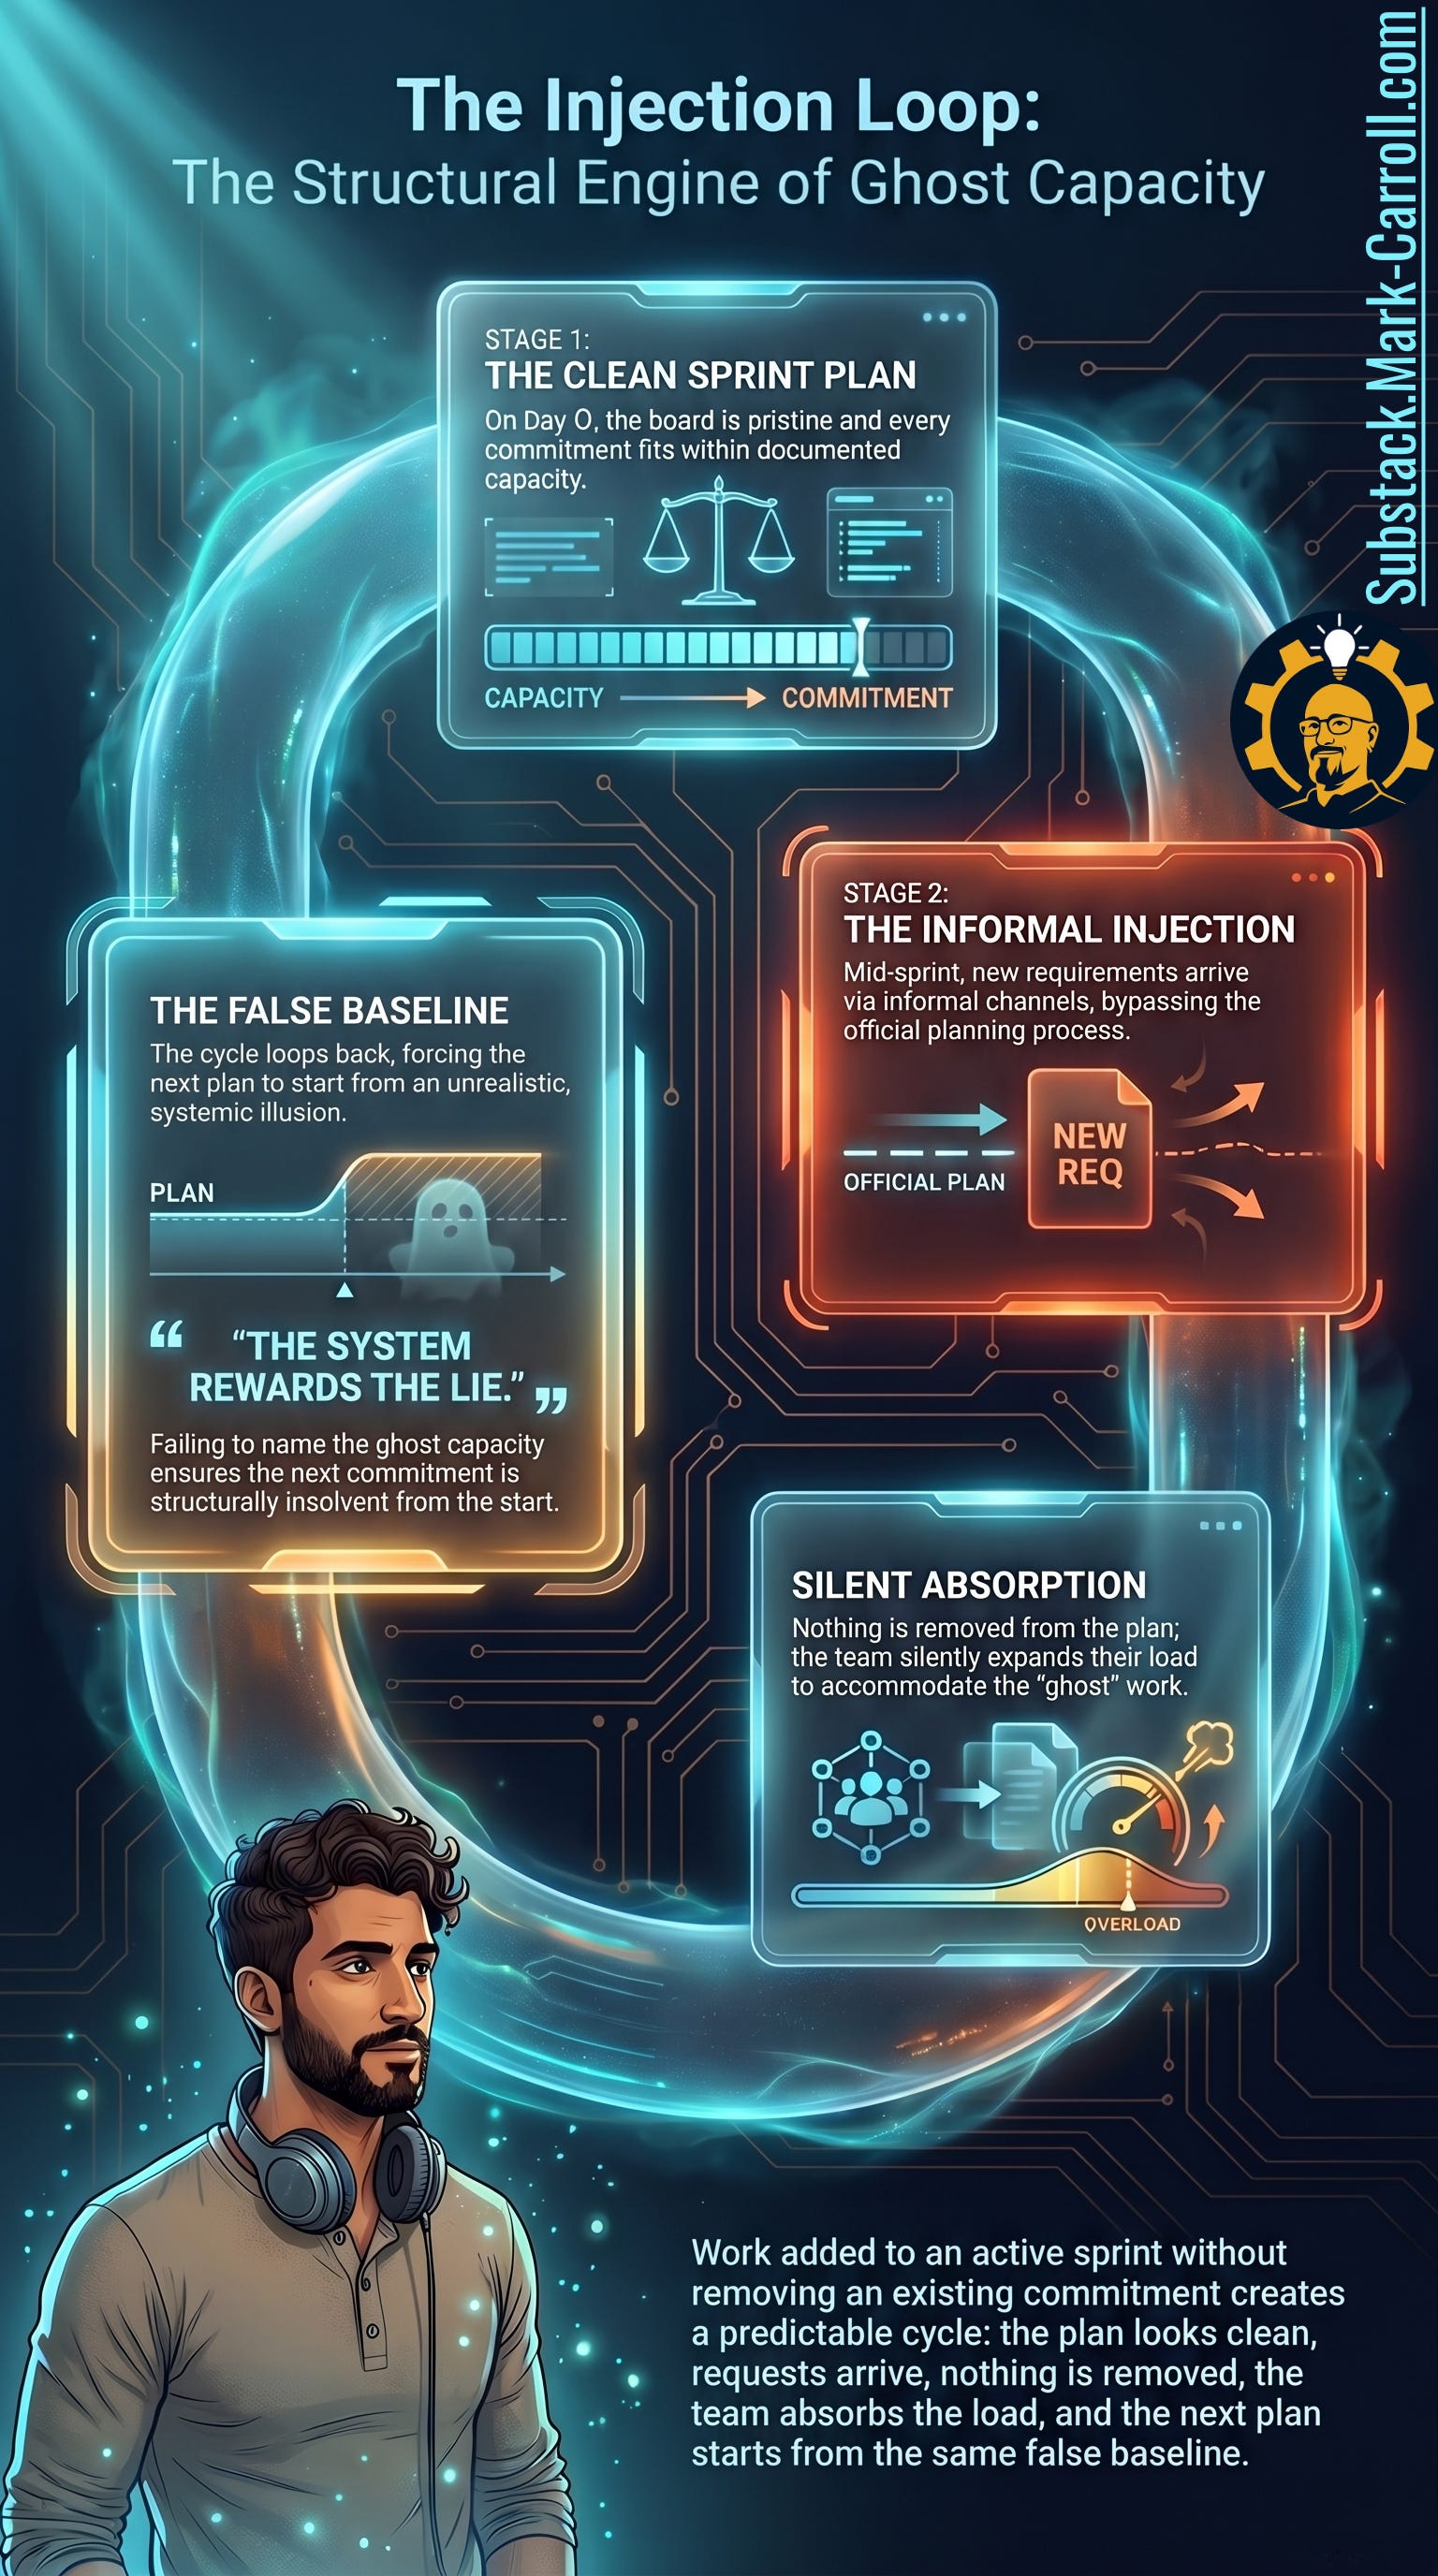
The sprint starts clean. New work enters informally. Nothing is removed from the original plan. The team absorbs the additional load without updating the commitment. The next sprint then starts from the same unrealistic baseline, because the previous sprint appeared to succeed. The illusion reinforces itself. Each cycle raises the organization’s expectation of what the team can carry, because the team kept carrying it. The fact that they carried it through overtime, cut corners, and quiet exhaustion does not appear in any system the planning process consults.
This is another broken route, but the one running between what the spreadsheet reports and what the team actually experiences.
Invisible work is not disruption. It is the operating system. The system fails to account for it because accounting for it would make the plan less comfortable to present, and the meeting rewards comfortable plans.
The loop has a shape. It repeats every sprint, and it starts from the same false baseline each time.
For the record, I’ve experience with all of this and my track record isn’t spotless. Case in point, a client once needed a “quick deck refresh” before their steering committee meeting, and I treated it like a light polish because the moment felt urgent. In reality, the refresh required new data, revised screenshots, updated assumptions, and a full review from engineering. Only later did I realize the ask was quick for me because someone else paid the recovery cost. I chalk this up as a lesson learned the hard way.
Three views of the same fiction
The resourcing lead sees efficiency. 80% allocated means the team is well-utilized. 20% available means there is room for new work. The model does exactly what it was designed to do.
The PMO and delivery function sees assignable bandwidth. The 20% is an input to the next project commitment. It enters a slide. It enters a timeline. It enters a promise made to a stakeholder who will hold the organization to it six months from now.
The engineers see a promise they cannot keep. The 20% does not account for the code reviews, the interrupt-driven support requests, the documentation debt, the undocumented recurring work, or the context-switching overhead that consumes twenty-three minutes of recovery per interruption. The capacity is real in the model. It is ghost capacity created within the building.
The presenter said the team had “roughly 20% available capacity” while the engineering lead was already on support rotation, carrying two production issues, and reviewing the architecture for a dependency nobody had staffed. The absurd part was watching that 20% get treated like available inventory, as if the person attached to it were sitting untouched on a shelf.
The system is optimized for utilization optics. High utilization looks efficient. Available capacity looks like slack to be assigned. So the resourcing model removes slack, fills available time, and calls it optimization. The engineers experience the optimization as drowning while the spreadsheet shows green.
This is not a communication problem. It is a decision structure problem.
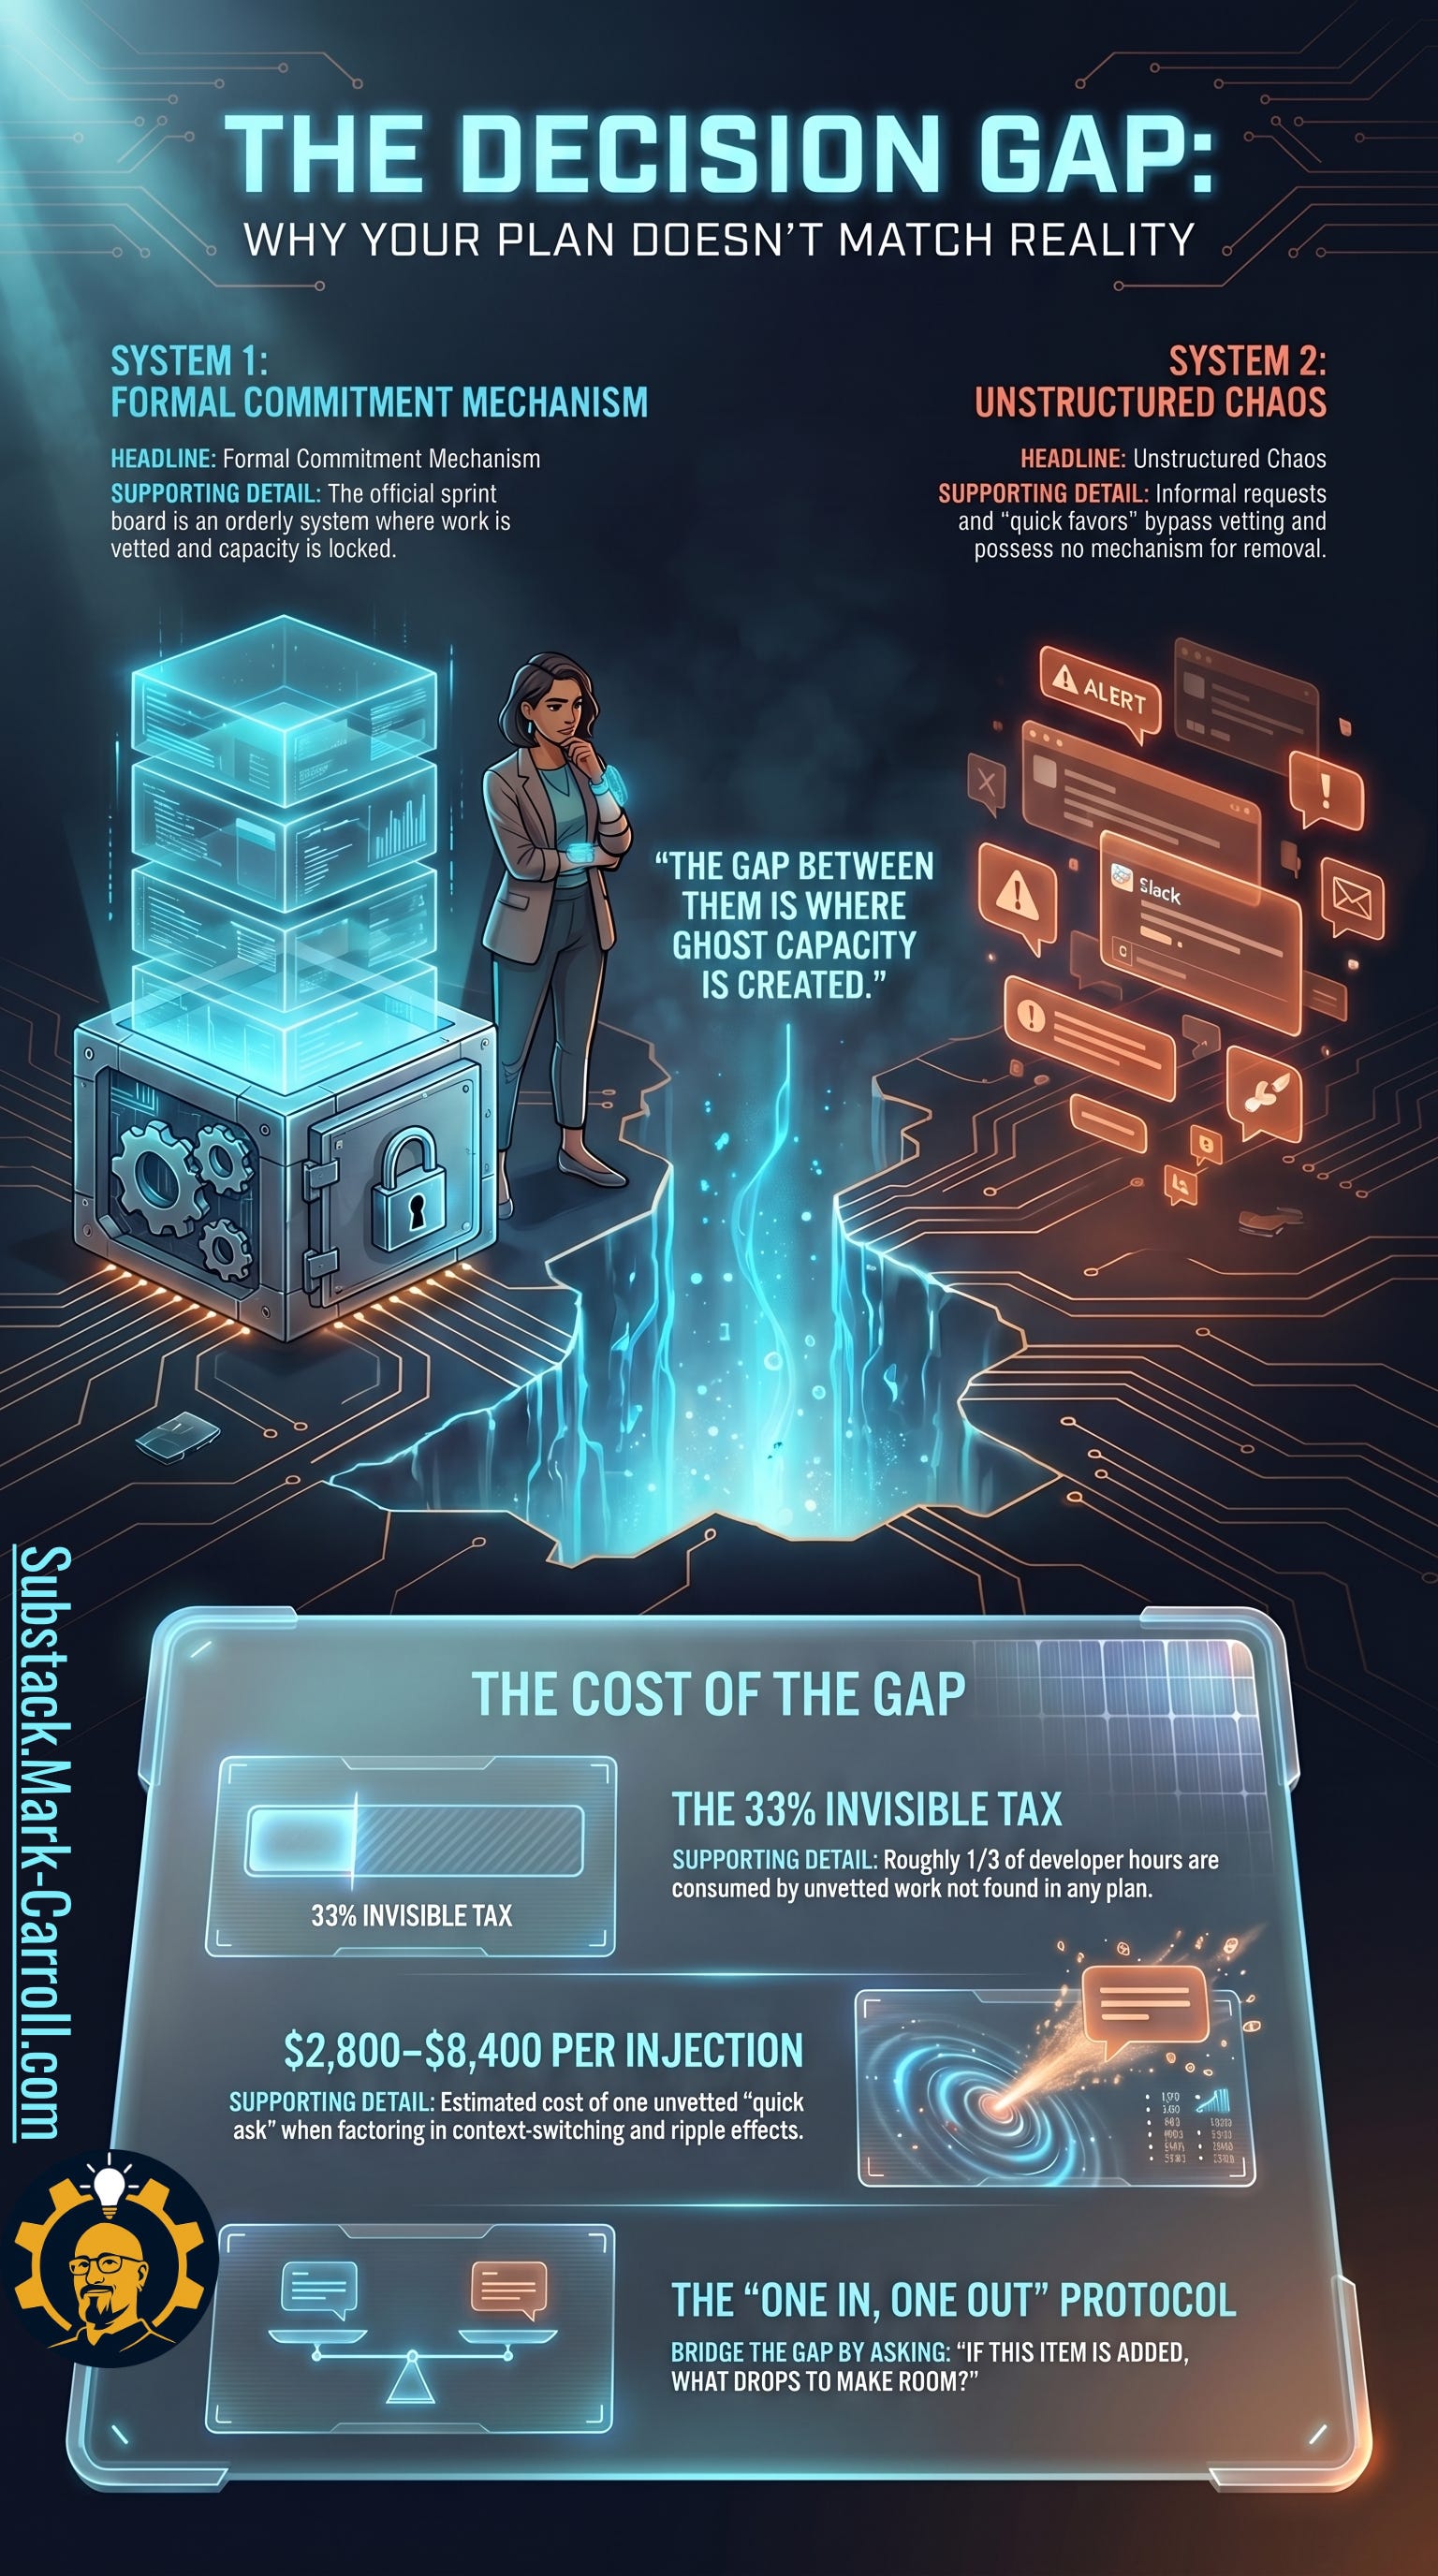
Formal commitments and informal requests follow different rules. Planned work moves through a structured mechanism where capacity is evaluated and locked. Unplanned work arrives through conversations, messages, and “quick favors” with no equivalent removal process. The gap between those two systems is where ghost capacity is created. A request can be valid, urgent, and strategically important without creating new capacity. When work is added without a tradeoff, the team is effectively financing that work through hidden effort.
Two systems operate simultaneously. One is structured.
One is not. The gap between them is where ghost capacity is born.
The spreadsheet shows green
Your capacity plan is not wrong. It is optimized for the person reading the spreadsheet, not the person living inside it.
That is the verdict. Everything else in this article exists to help the reader make that verdict financially legible. Not universally, not theatrically, and not with fake precision dressed up as proof. Locally. Defensibly. In the language of the next capacity planning conversation.
The organization now operates on two realities. The visible one, where the plan reconciles and the sprint looks viable, and the operational one, where the team is already absorbing work the plan never acknowledged. Both realities cost money. Only one appears in the reporting. The gap between them is the exposure this article prices.
What the evidence actually lets us price
There is no clean, universal benchmark for ghost capacity cost. There is no portable industry number you can borrow, place into a chart, and treat as revealed truth. What the evidence does support is a structural model grounded in defensible benchmarks that the reader can apply to their own environment.
The CISQ 2022 Cost of Poor Software Quality report estimates that roughly 33% of developer time is consumed by unplanned work and rework. Google’s DORA State of DevOps research consistently finds that sustainable work pace correlates with delivery performance, and that organizations protecting capacity outperform those optimizing for utilization. Context-switching research estimates that each interruption costs approximately twenty-three minutes of recovery time before deep-focus work resumes. The figure originates from Gloria Mark’s work at UC Irvine on workplace interruptions and has been widely cited across productivity research. A ten-minute favor actually burns closer to thirty-five minutes of cognitive runway.
Start with a 10-person team running two-week sprints. Eight hundred total team hours per sprint. Apply the CISQ 33% benchmark: roughly 264 hours per sprint are consumed by work the plan does not track. Use the BLS median loaded labor rate of approximately $70 per hour. That is roughly $18,500 per sprint in ghost capacity for unplanned work alone. Factor in context-switching overhead and recovery time and the range widens to $36,000 to $45,000 per sprint. Annualized across 26 sprints, that produces roughly $480,000 in capacity exposure for a single 10-person team at the CISQ 33% benchmark. Organizations running lower ghost percentages or lower loaded rates will land closer to $390,000. The range depends on your inputs. The structure does not.
(These are modeled estimates using research benchmarks and BLS salary data, not a universal cost figure. Your numbers will differ. The structure will not.)
That is not just cost. That is lost optionality. This is why migrations slip without being reprioritized. This is where roadmap confidence erodes without an obvious failure. This is why teams feel busy while strategy stalls. The money is real. What it could have purchased is the part that keeps compounding.
Here is the structure. Here is what it costs a single team for one year.

The Ghost Capacity Ratio
Reported available hours divided by hours that can actually be directed to new planned work after subtracting context switching, interrupts, undocumented recurring obligations, and recovery overhead.
If the ratio is above 1.5, the gap between the spreadsheet and reality is large enough to be costing real money every sprint. If you cannot calculate this ratio for your team in under thirty minutes, that is not a data inconvenience. That is the finding.
Three things the spreadsheet teaches people to say
“But we already account for overhead.” Most capacity models deduct holidays, PTO, and maybe training. They do not deduct context switching, interrupt-driven support, code review obligations, documentation debt, undocumented recurring work, or recovery time. That is why the plan starts at 80% allocated and still fails by Wednesday.
“This is just engineers complaining about being busy.” It is a capacity measurement question. The spreadsheet reports one number. The building operates on a different one. This article is asking which number your next commitment should be based on.
“We cannot reduce unplanned work to zero.” Correct. The artifact is not designed to eliminate it. It is designed to make it visible before commitments are made, so the next promise is based on reality, not on the plan’s comfortable fiction.
What leaders should do next
Before you run the Capacity Reality Check, try this. Pick one team. One sprint. No permission slip required.
Name the ghosts. Write down every category of work that consumed team time but did not appear in the original sprint plan. Unplanned requests, interruptions, context-switching overhead, code review, undocumented recurring obligations. Do not judge. Just list.
Count the injections. How many times did something enter the sprint without anything being removed or deferred? One count. One number.
Estimate one ghost. Pick the most frequent category. Use your loaded daily rate and a conservative time estimate. Multiply by the number of occurrences in one sprint. Round down. You are building a floor, not a ceiling.
Calculate the delta. Hours committed to planned work minus hours actually available after ghost work is subtracted. Apply the loaded rate. That is your ghost capacity cost for one sprint.
Bring the number. One slide. One sprint. One team. Show the number in the next capacity planning conversation. Not a verdict. A range. Ask the room: is this number surprising?
If that number surprises you, the Capacity Reality Check will not.
It will just make that number visible every sprint, before the commitment is made.
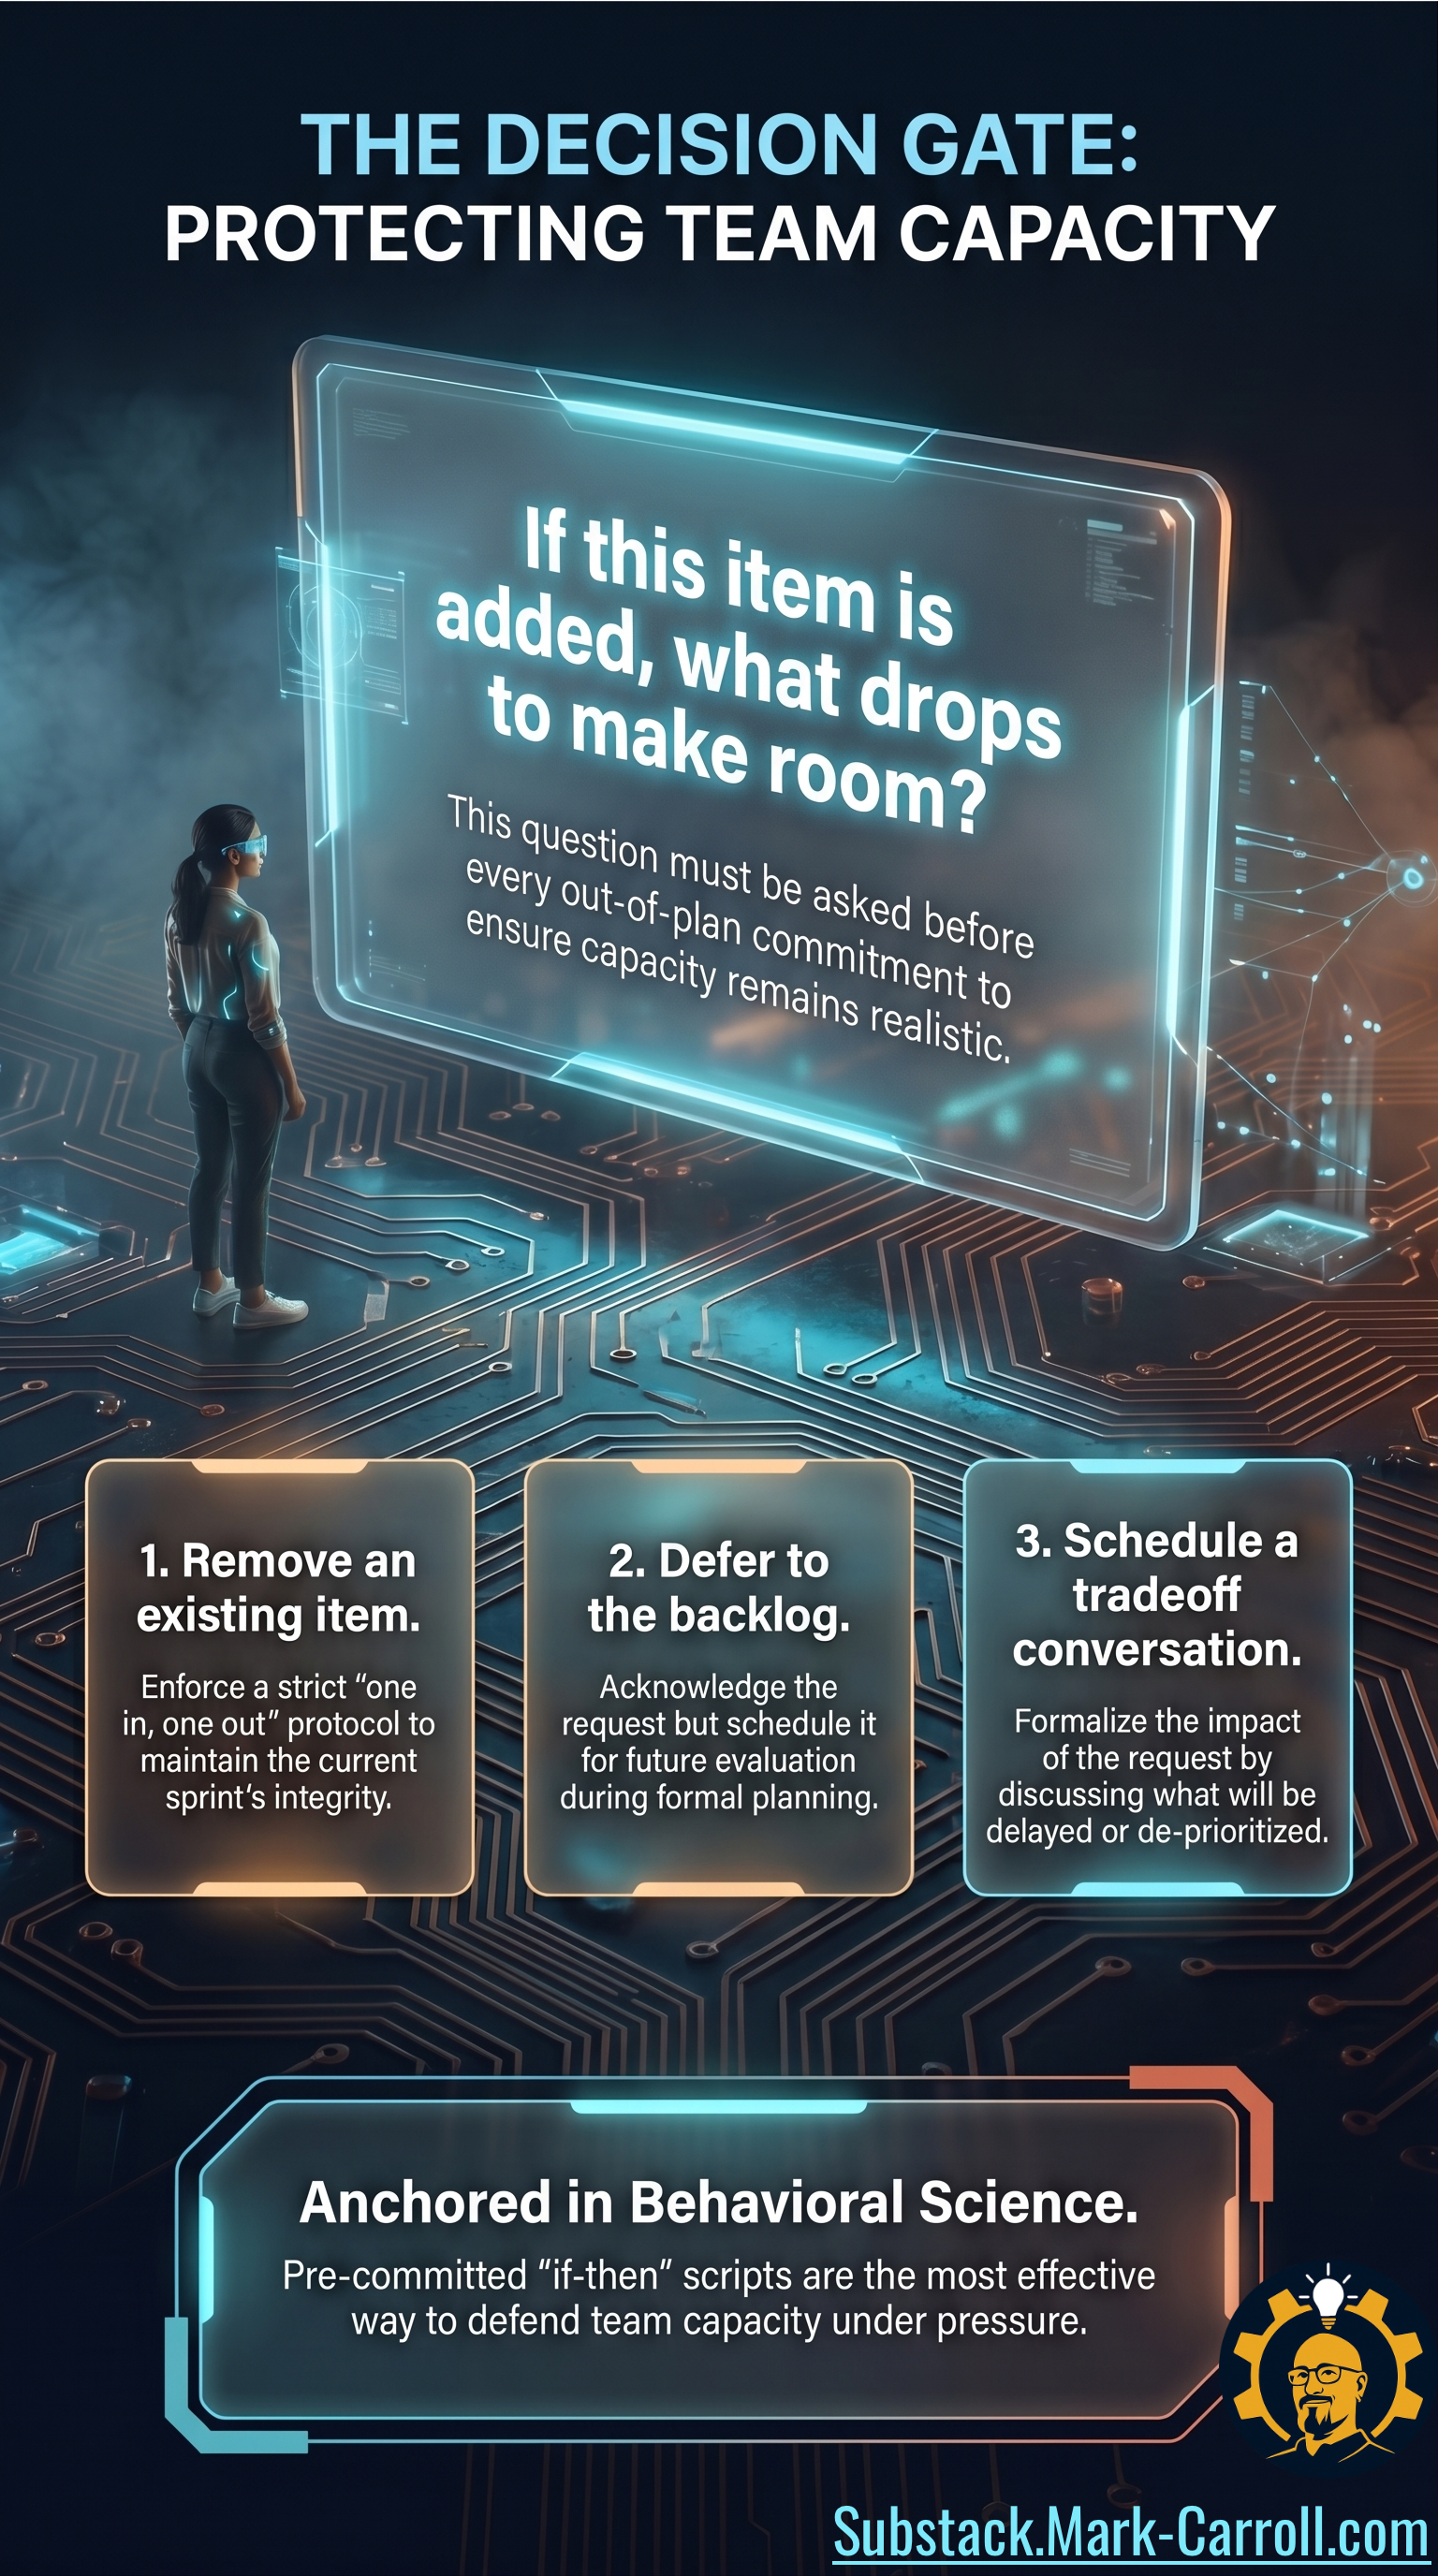
The Decision Gate
Every new request that enters an active sprint needs one of three responses.
Remove. Something currently in the plan comes out to make room.
Defer. Something currently in the plan moves to the next sprint with a named re-entry point.
Escalate. A tradeoff conversation happens with someone who has the authority to reprioritize.
Every untraded addition is a hidden tax the team just agreed to pay.
If a new item enters the sprint without triggering one of these three responses, the team is funding that work with ghost capacity. The cost is real. It is just not on anyone’s ledger.
Every new request needs one of three responses. If none of them fires, the team is financing that work with capacity the plan already spent.
The Capacity Reality Check
Once you name the ghosts, the next question is obvious: how much capacity are they consuming? That is what the Capacity Reality Check gives you.
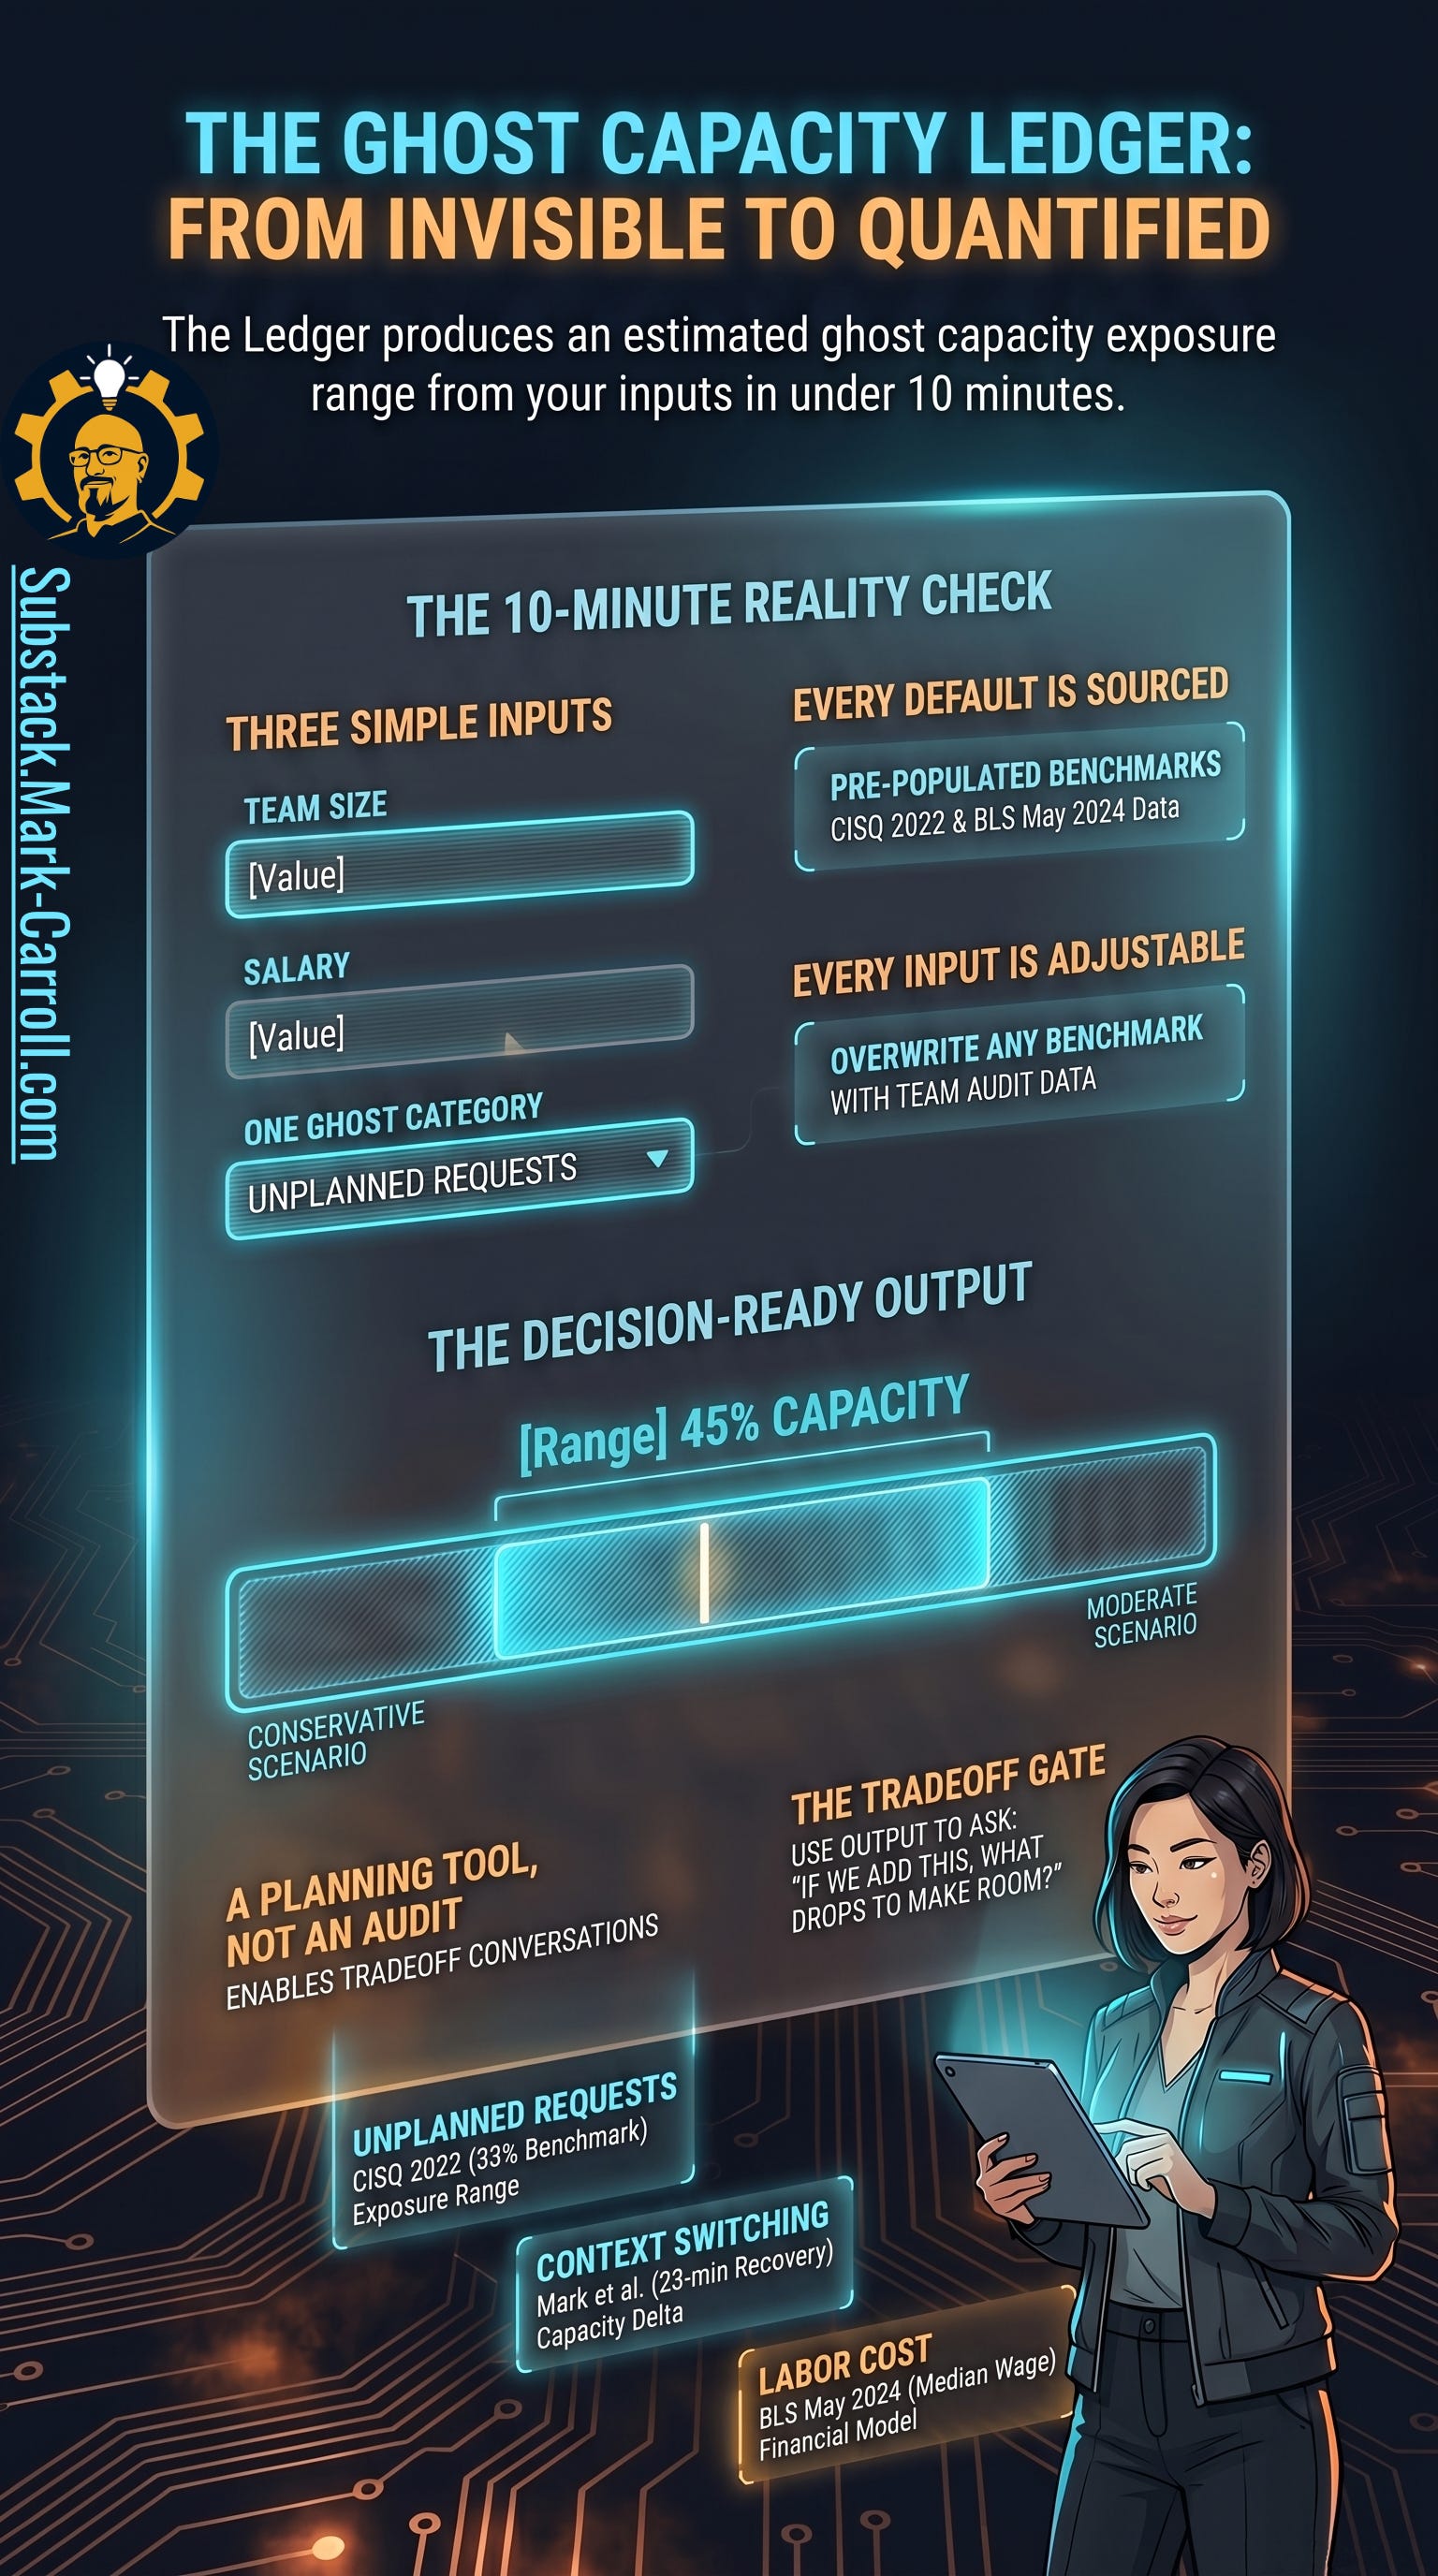
What it is. A branded Excel workbook with four tabs: Start Here (a plain-language walkthrough that orients you in minutes), Capacity Inventory (where the six ghost categories are entered with time estimates and loaded rates), Executive Summary (a one-page, screenshot-ready strip for a QBR or board packet), and Gap Analysis (a ranked view of ghost categories by cost exposure with conservative and moderate scenario ranges).
What it calculates. Scheduled capacity versus actual available capacity across six adjustment categories. True available capacity as a percentage of scheduled capacity. The dollar delta between what was promised and what can be delivered. Per-sprint and annual exposure ranges.
What it answers. The one question most teams cannot currently answer: what percentage of your reported available capacity is ghost capacity that has already been consumed by work the plan does not track?
What conversation it supports. Capacity planning, quarterly commitment reviews, sprint retrospectives, and any room where someone is about to promise delivery based on a spreadsheet that has never been audited against reality.
Designed to be opened and understood in under ten minutes. The Executive Summary tab is built to be screenshot or forwarded to a VP, CFO, or board as a capacity-prioritization argument. The defaults are pre-populated from the article’s illustrative numbers so you immediately see the math in action and can substitute your own.
Subscribers will find the Capacity Reality Check below. It calculates the gap between your spreadsheet and your building. If you want the tool, it is here:
The plan did not fail. It never reflected reality.
The sprint does not fall apart because teams lack discipline or effort. It falls apart because the planning system does not account for the full set of forces acting on capacity. The plan reflects the visible system. Execution reveals the real one.
The point is not to produce a definitive number for invisible work. The point is to remove the organization’s ability to keep planning against a fiction. Once that number exists, even as a bounded estimate using local inputs, it becomes harder to promise delivery using a spreadsheet nobody has audited against reality (unlike the Capacity Reality Check above).
Visibility does not add capacity.
It adds accountability to the conversation about how capacity is used.
You are not walking in to prove the plan is wrong. You are walking in to show what the plan cannot see. Bring the numbers, show your inputs, and let the conversation shift from an opinion to a tradeoff with receipts.

That is also the larger case behind my upcoming book, Collaborate Better. Better collaboration is not about being nicer in meetings. It is about reducing avoidable friction before it turns into waste, delay, and preventable cost. When resourcing models promise capacity that does not exist, teams absorb the damage. Collaborate Better is the manual for stopping that human and financial bleed. Learn more at CollaborateBetter.us.
Next week in Part 8: When Profit Depends on One Person. The season finale. Seven episodes have priced the hidden costs inside your delivery system. Episode 8 prices the person who has been absorbing them.

P.S. Before your next capacity meeting, pick one person your plan shows as “available” and list every invisible obligation already attached to them: support rotation, code review, production noise, onboarding, stakeholder pings. If the list takes more than a minute to write, that person is not available in the way the spreadsheet says.
Regards,
Mark 👋
Empathy Engine | Substack.Mark-Carroll.com | Evidence-Forward Product Leadership

Previous:

More Content to Discover:


Most teams don’t have a capacity problem. They have a visibility problem.
If you’ve ever watched a plan look clean on Monday and feel impossible by Wednesday, I’m curious:
What is the most “invisible” work that keeps showing up in your team’s week?
Support? Interruptions? Reviews? Something else entirely?
Drop it below. I read every reply, and the patterns here shape what I build next.
Holy moly, this is powerfully thinking. Can’t wait to read Part 8. Something tells me it’s going to hit hard.