Recovery tells you the service works again. It doesn’t tell you the risk went down.
Opening
The alert fires at 6:12 on the last Thursday of the quarter.
The partner order feed has stopped. Orders pile up in a queue that nobody outside Operations knew existed until this morning. Renee, the delivery lead, opens a bridge call. Omar from Engineering finds the stuck job, restarts it, and re-runs the morning’s batch by hand. By 7:40 the orders are flowing again.
It’s a good recovery. Calm, fast, nobody yelling. Renee thanks everyone on the bridge. Anika, the product lead, sends the partner a short note. By lunch the incident is marked resolved.
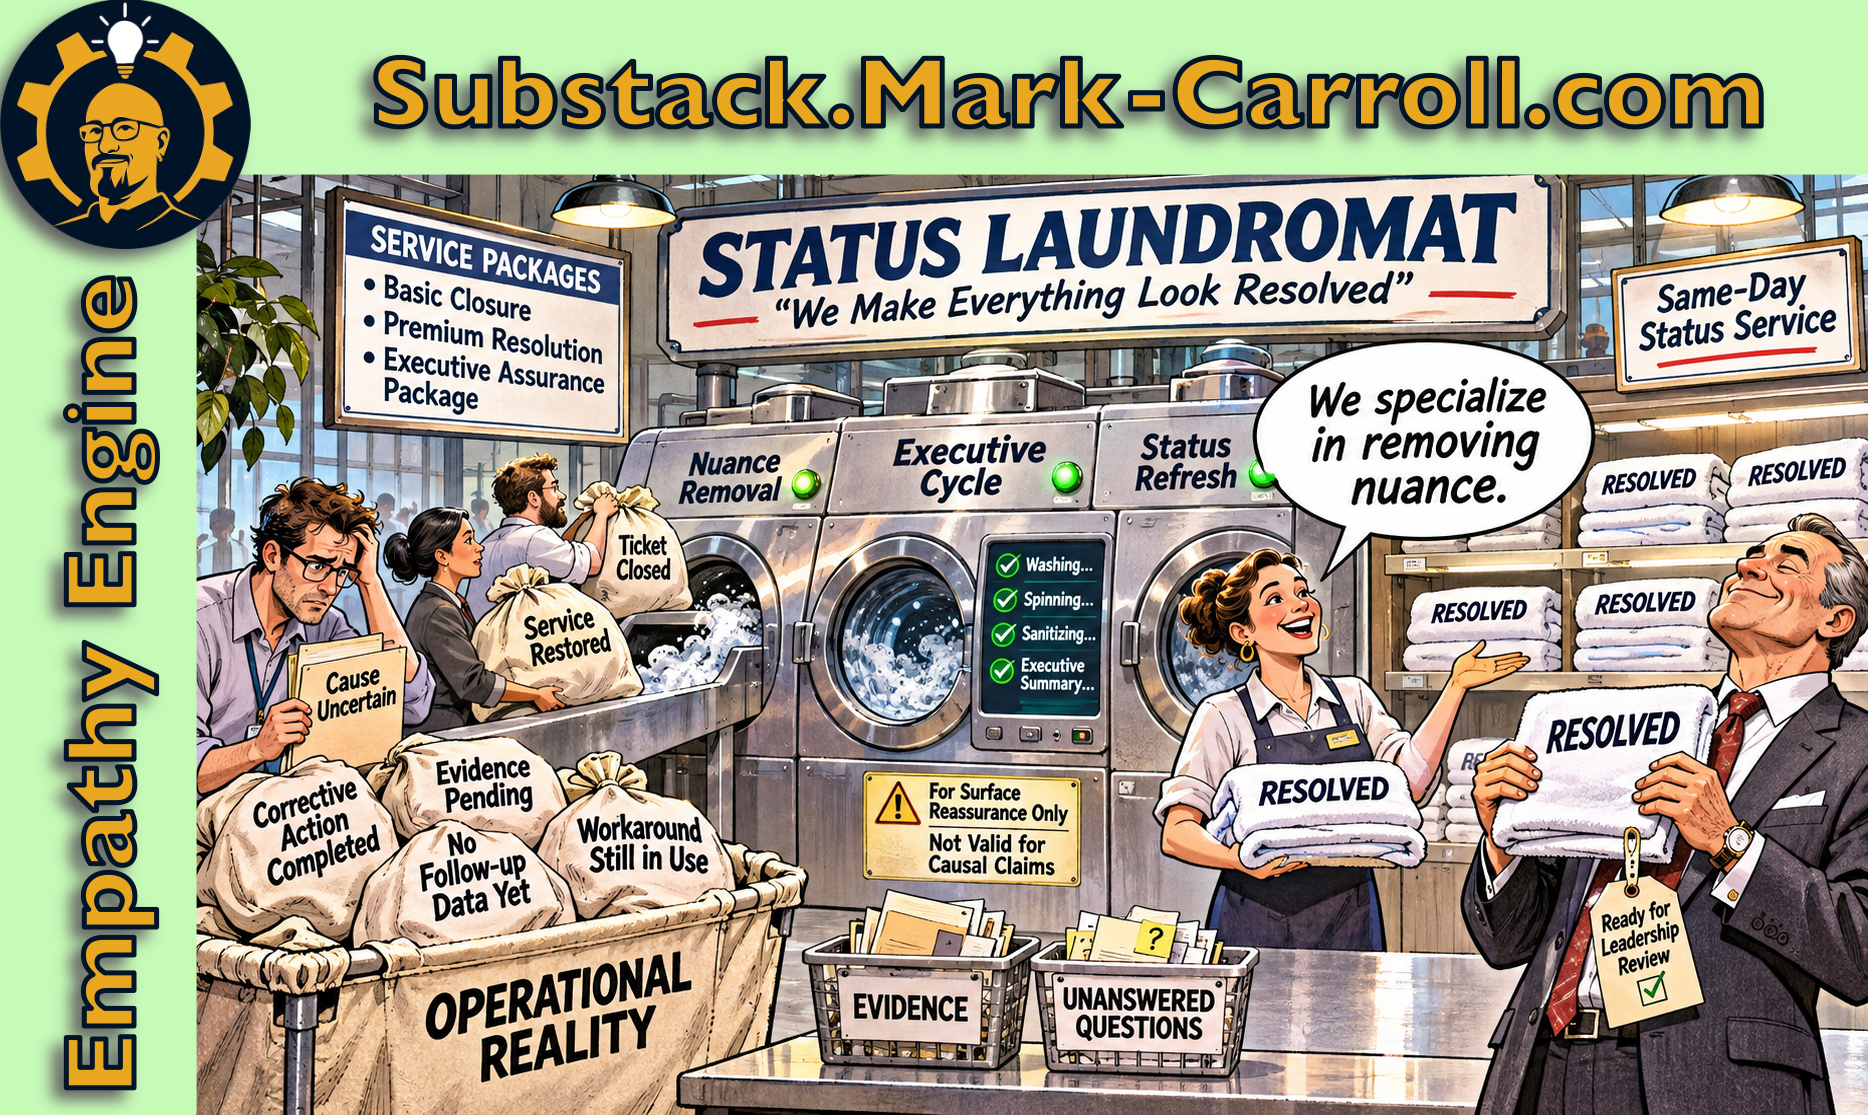
On Monday the team reviews it. The job failed when an upstream service timed out. Someone proposes retry logic. Omar takes it. Two weeks later the ticket closes: retry logic added. Done.
Six weeks after that, on the last business day of the month, the same alert fires. Same feed. Same stuck queue. Same bridge call.
And somebody says the sentence every team eventually says: “Didn’t we fix this?”
A note on that scene. It’s an illustrative scenario, not one company’s case file. Renee, Omar and Anika are invented. The moment is one I suspect most people who coordinate cross-functional work will recognize.
Now, the honest part. Maybe the retry logic works perfectly and this is a different failure that looks the same. Maybe the fix reached only part of the system. Maybe month-end volume is something the team never tested against. Maybe it really is the same problem, and the fix missed.
Before anyone picks one, notice what the team actually knows. The service was restored the first time. A corrective action was closed. Whether either of those changed the odds of a repeat is still an open question.
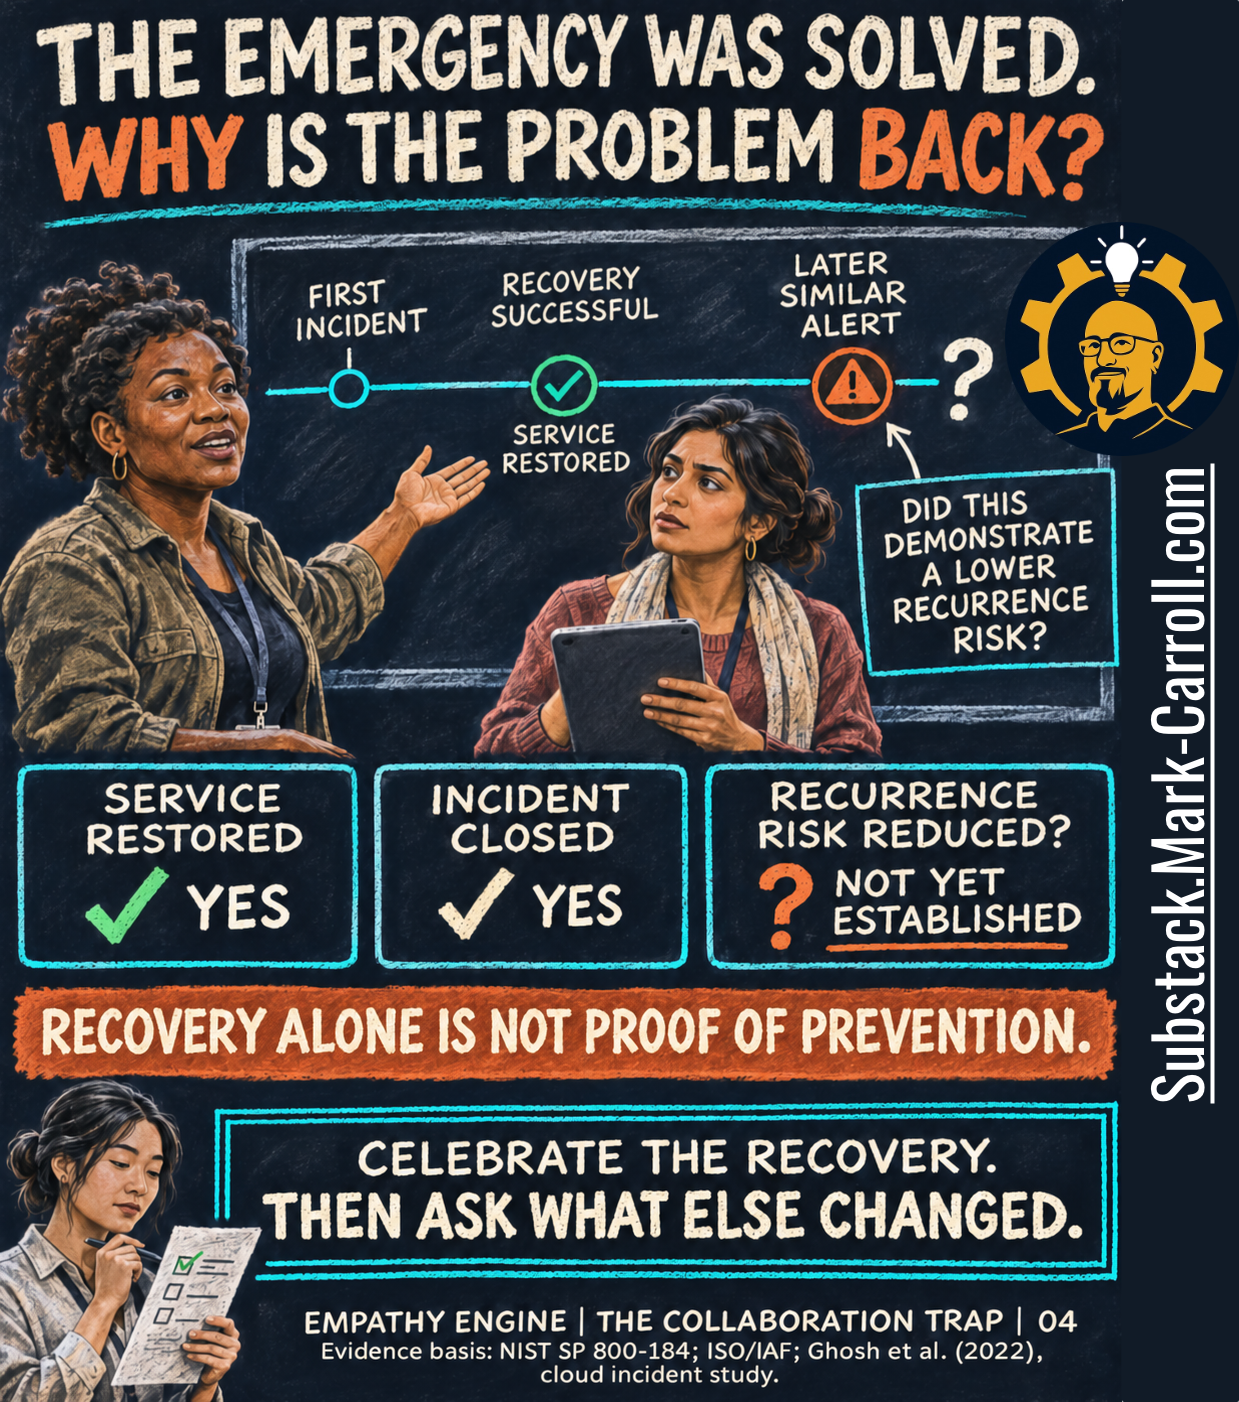
The three boxes under the timeline say it plainly. Service restored: yes. Incident closed: yes. Recurrence risk reduced: not yet established. Not “no.” Not “the team failed.” Just a question nobody had evidence to answer.
That’s the trap this week. Recovery alone is not proof of prevention. A team can do the hard part brilliantly, get the service back, close every ticket, and still not know whether the conditions behind the failure changed.
Which brings me to a correction on last week’s teaser. I promised an article called Why Smart Teams Keep Solving the Same Problem. Two words in that title didn’t survive the research. “Keep” implies I know how often this happens. I don’t, and the research I reviewed doesn’t either. “Why” implies I can name the cause. The most popular explanation, that teams get so good at firefighting they stop investigating, turned out to have weak evidence behind it. Plausible, yes. Established, no. So the title became the question the evidence actually supports.
The tool I promised is still here. The Recurring Problem Diagnostic waits for you near the end. It just does a smaller, more honest job than “breaking the loop.” It helps you see which result you actually have.
It starts with a celebration. Nobody in our scene did anything wrong by fixing the feed fast. The recovery is real work and it deserves real credit. It just answers a different question than the one that showed up six weeks later.
Celebrate the recovery.
Then ask what else changed.
What if the biggest obstacle to collaboration isn’t the people, but what we’re overlooking between them?

My new book, Collaborate Better, explores how we can break through organizational silos, solve problems together, and turn individual contributions into shared success.
Your road to better collaboration starts here.
Get your copy today at https://CollaborateBetter.us
Research Binder: the receipts (citations + source notes) are compiled in a PDF at the bottom of this post.
Over eight Wednesdays, The Collaboration Trap chases one question: what is making capable people struggle to do good work together? Part 1 looked at the gap between finished and delivered. Part 2 looked at the gap between a meeting that happened and a meeting that did its job. Part 3 looked at the gap between agreeing on a direction and committing to the next move. This week’s piece is the gap between getting the service back and knowing whether recurrence risk was reduced.
Episode 1:

Episode 2:

Episode 3:

Restored isn’t the same as prevented
Go back to the word on Anika’s status update: resolved. It’s one word doing the work of several.
It might mean the service is running. It might mean someone found what contributed to the failure. It might mean a fix was chosen, built, or shown to work. Those are different accomplishments. In conversation they collapse into one word, and the word sounds finished.
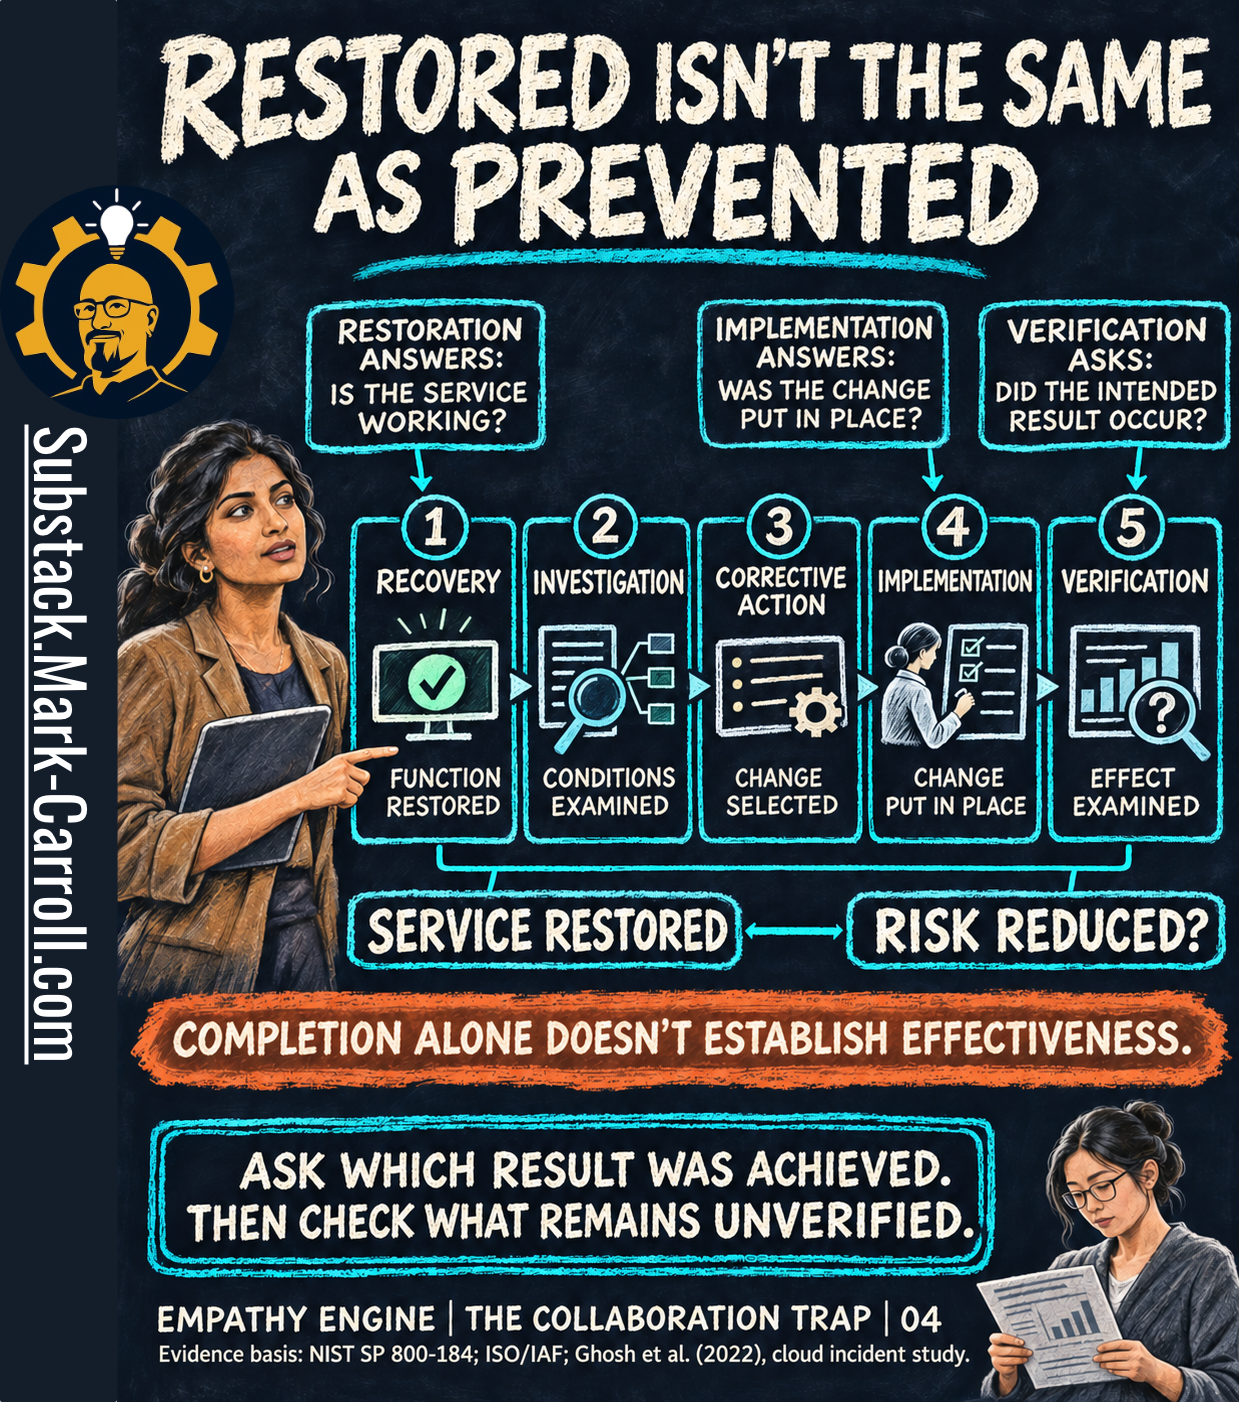
The graphic pulls that word apart into five stages: recovery, investigation, corrective action, implementation, verification. Map our scene onto it. Omar restarts the job (recovery). Monday’s review asks what made it fail (investigation). The team picks retry logic (corrective action). Omar ships it and closes the ticket (implementation). Then comes the stage nobody put on a list: checking whether the change did what it was meant to do (verification).
Notice the verb shift in the callouts. Restoration answers whether the service is working. Implementation answers whether the change was put in place. Verification asks whether the intended result occurred. The first two answer. The last one still asks.
The distinction isn’t my invention. NIST’s Guide for Cybersecurity Event Recovery (SP 800-184) treats recovery and continuous improvement as connected but separate capabilities. Joint ISO and IAF auditing guidance on closing nonconformities separates the immediate correction from causal analysis, corrective action, and a later review of whether the action was effective.
The closest look at real software teams comes from Supriyo Ghosh and colleagues, who studied hundreds of high-severity production incidents and their postmortems at a large cloud service. Their analysis treats detecting a problem, finding what caused it, and mitigating it as distinct stages. Its limit matters: the study examined how incidents were detected and resolved, not whether follow-up actions reduced recurrence. It supports the idea that these stages differ. It doesn’t validate this five-stage picture as a procedure.
Matt Pope and Jonathan Sillito add a piece at stage three. In a preliminary study of 104 action items from public software incident reports, choosing what to change turned out to be its own problem, with its own motivations and goals. It didn’t track whether those actions were finished or worked.
One caution, because this graphic could easily become a compliance ritual. It’s a way of asking better questions, not a mandatory five-gate process for every blip. A minor, well-understood interruption may need nothing past recovery. A repeat failure in a critical system may need all five. Match the depth of follow-up to the consequences and the uncertainty.
That’s the orange banner: completion alone doesn’t establish effectiveness.
So the next time someone says “resolved,” try one gentle follow-up: “Resolved as in it’s running again, or resolved as in we have evidence the relevant conditions changed?” If the answer is the first one, that’s still useful clarity. Now everyone knows which result they have.
Ask which result was achieved.
Then check what remains unverified.
The same symptom doesn’t prove the same cause
“Didn’t we fix this?” carries an assumption inside it: that this is the same thing as that.
It might be. Same feed, same alert name, same stuck queue. From the bridge call, it looks identical. But the first failure came on a quiet Thursday morning when an upstream service timed out. The second came on the last business day of the month, at peak order volume. Two different sets of conditions can produce one identical symptom.
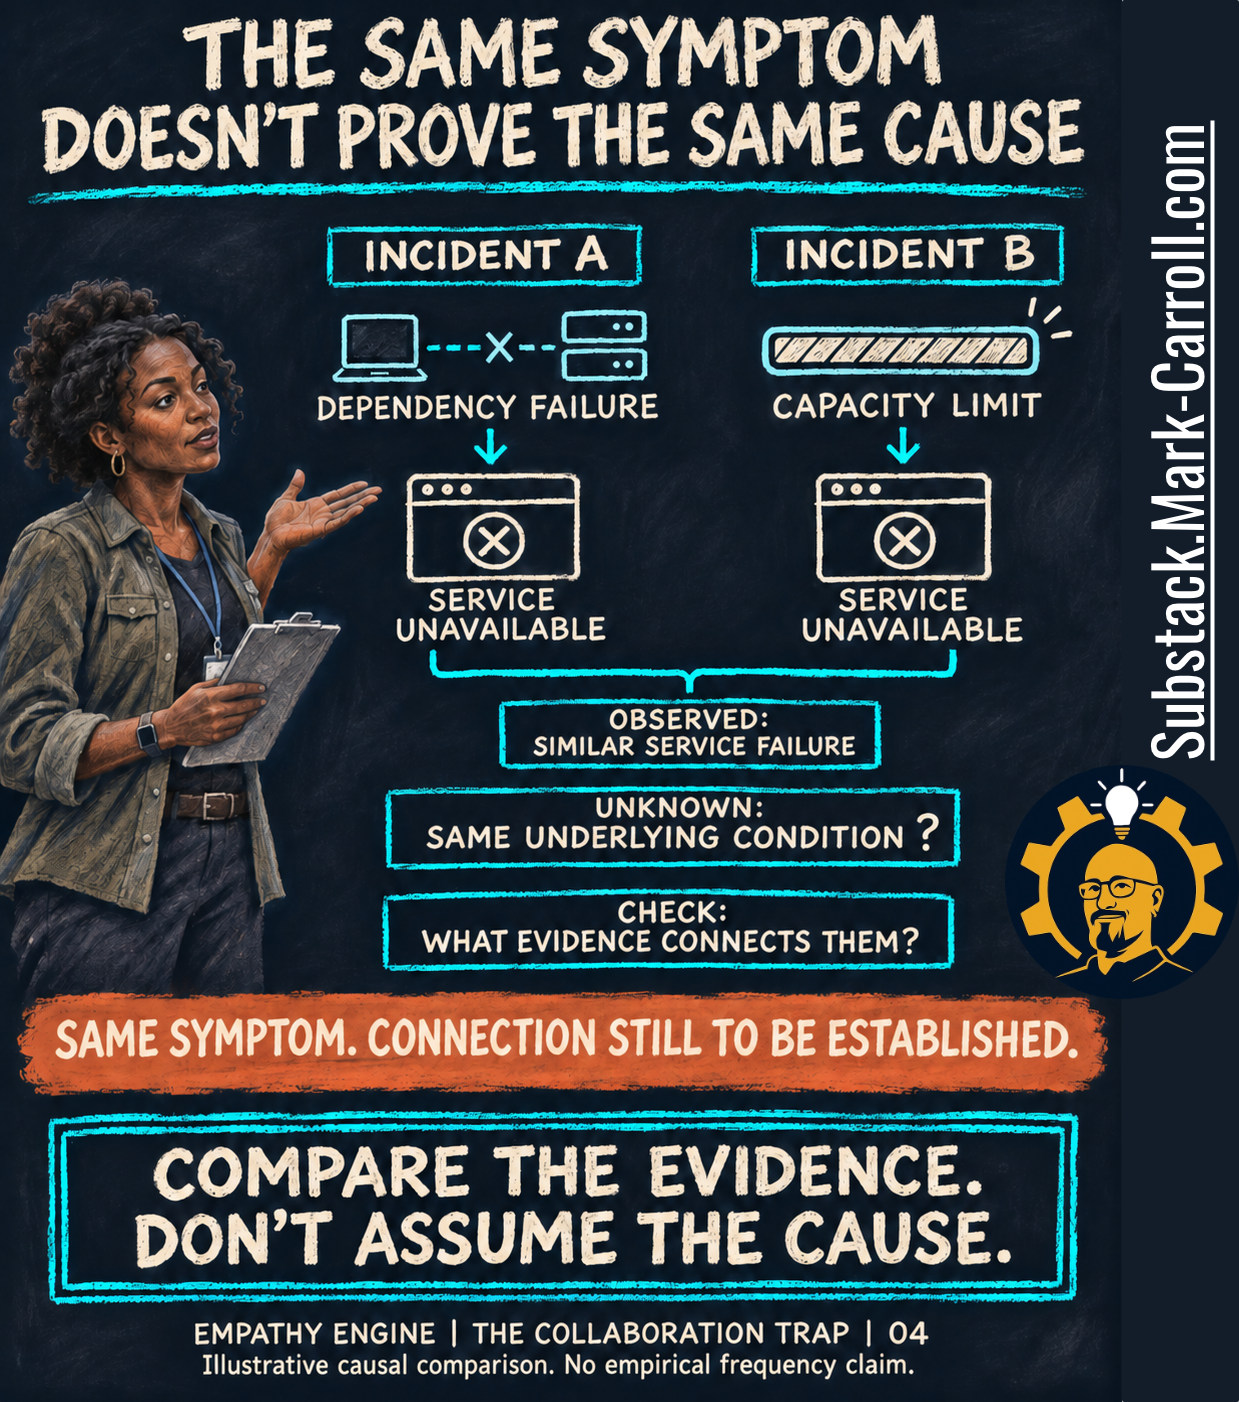
The graphic shows exactly that. Incident A starts with a dependency failure. Incident B starts with a capacity limit. Both land on service unavailable. The three boxes underneath are the whole method in miniature: what was observed, what’s still unknown, and what you’d check to connect them.
Now look at Omar’s retry logic. If the second failure came from a capacity limit, the retries may be working exactly as designed and still not touch it. Retrying against a service that’s out of room could even add load. Reusing the earlier fix without examining the new incident can waste effort, leave the relevant conditions alone, or create new complications.
The opposite reflex has a cost too. Treating every occurrence as unrelated can hide a pattern worth investigating. Different-looking causes also don’t prove two incidents are unrelated. One upstream condition, say a partner system that slows down at month end, could contribute to both. Establishing that would take more evidence.
The graphic’s footer is honest about its limits: an illustrative causal comparison with no empirical frequency claim. The research supports the method, not a statistic. Investigators treat symptom similarity as a reason to look, not proof of a shared cause. I couldn’t find a reliable measure of how often similar-looking incidents have different causes in product and program teams, so I’m not claiming most repeats are secretly different problems. I’m saying you can’t tell from the symptom alone.
That’s the orange banner: same symptom. Connection still to be established.
So before the next review opens with “this happened again,” start smaller: “What do we know that connects this one to the last one?” Compare the logs, timing, load, recent changes and dependencies. If the evidence supports a shared explanation, pursue it. If it points somewhere else, revise. If it’s inconclusive, say so.
Compare the evidence.
Don’t assume the cause.
When a workaround becomes part of the way we work
One more thing happened that first Thursday morning, and nobody wrote it down.
To get the orders moving, Omar re-ran the morning’s batch with a short script he keeps on his laptop. It worked. It’s also not in any runbook.
By the second incident, the script was simply how the team works. When the feed stalled, the first thing anyone said was “Ping Omar, he has the thing.” Mei, who joined in between, learned the move during her first on-call shadow shift. When she asked about the documented procedure, the answer was the one every new hire eventually hears: “That’s technically the process. Here’s how we actually get it done.” Nobody decided the script should become the process. Nobody decided it shouldn’t. It just stayed.
The obvious next sentence is that this is dysfunction. I’d resist it.
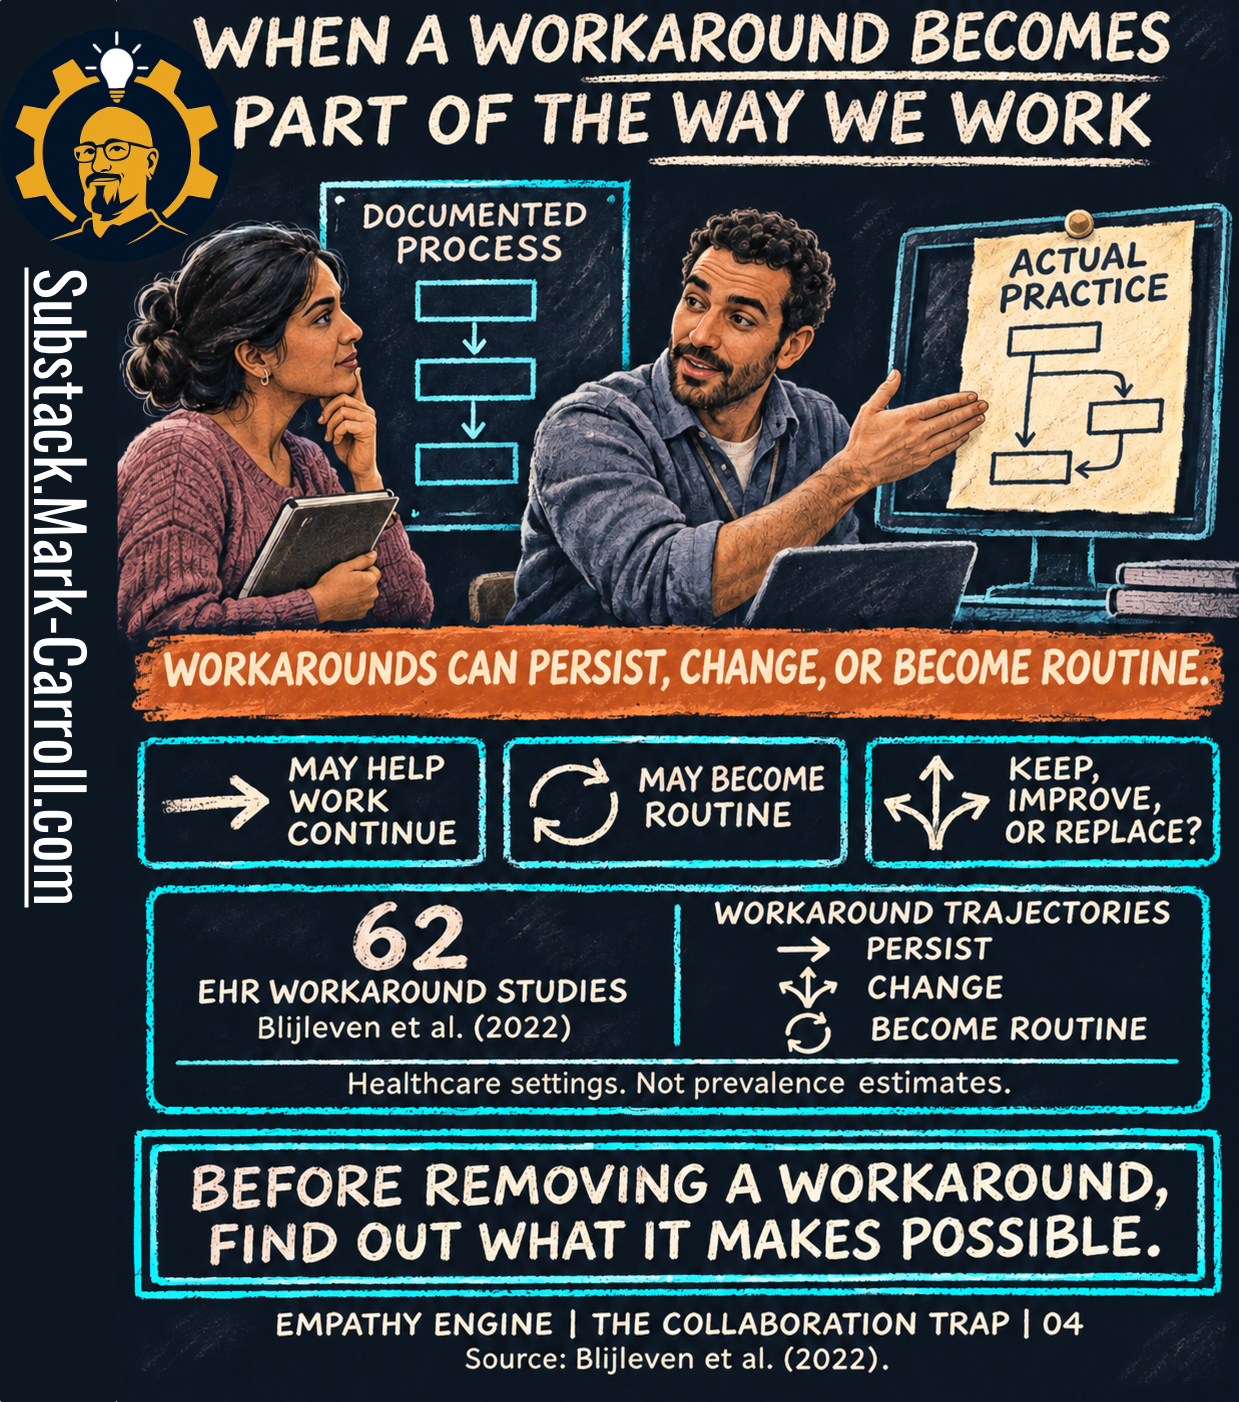
The graphic sets the documented process beside actual practice and labels neither one wrong. The banner says only what we can support: workarounds can persist, change, or become routine. The three boxes underneath keep both sides in view. A workaround may help work continue: Omar’s script got orders flowing in under ninety minutes. It may become routine: a fix for one bad morning is now day-one training. And it raises a decision nobody has made: keep, improve, or replace?
Practitioners describe this with some feeling. One project manager on Reddit’s r/projectmanagement wrote that the most worrying undocumented item is often “the workaround holding something important together.” That’s one person’s observation, not a measure of how common this is.
The research supports something narrower and still useful. Vincent Blijleven, Florian Hoxha and Monique Jaspers reviewed workarounds in electronic health record systems, screening 737 records and including 62 studies. Across them, workarounds arose for many reasons, took many forms, and had a mix of perceived effects. Some helped people work when the system didn’t fit the job. Some created new risks. Many did both. An earlier review of nurses’ workarounds, by Deborah Debono and colleagues, found the same variety.
The stat card names the limits: healthcare settings, not prevalence estimates. Sixty-two is the number of studies in the review, not a count of workarounds anywhere. It doesn’t tell you how often workarounds in product teams become permanent or cause harm. It tells you they can stick, and that whether that’s good depends on the workaround.
So Omar’s script might be the team’s most reliable recovery tool. It might also be a single point of failure living on one laptop. Probably both. Calling it “technical debt” before anyone looks at it would be a judgment, not an observation. So would calling it fine.
Before removing a workaround,
find out what it makes possible.
The corrective action is complete. But did anything improve?
Let’s give Omar’s team a better Monday. This isn’t what happened next. It’s a different version of the same review.
This time the team does everything the textbooks ask. They map the timeline. They name contributing factors instead of a culprit. They choose a corrective action, assign it, set a date, and track it to done. The ticket closes on time.
Is the problem prevented now? Still not necessarily, and nobody in this version cut a corner.
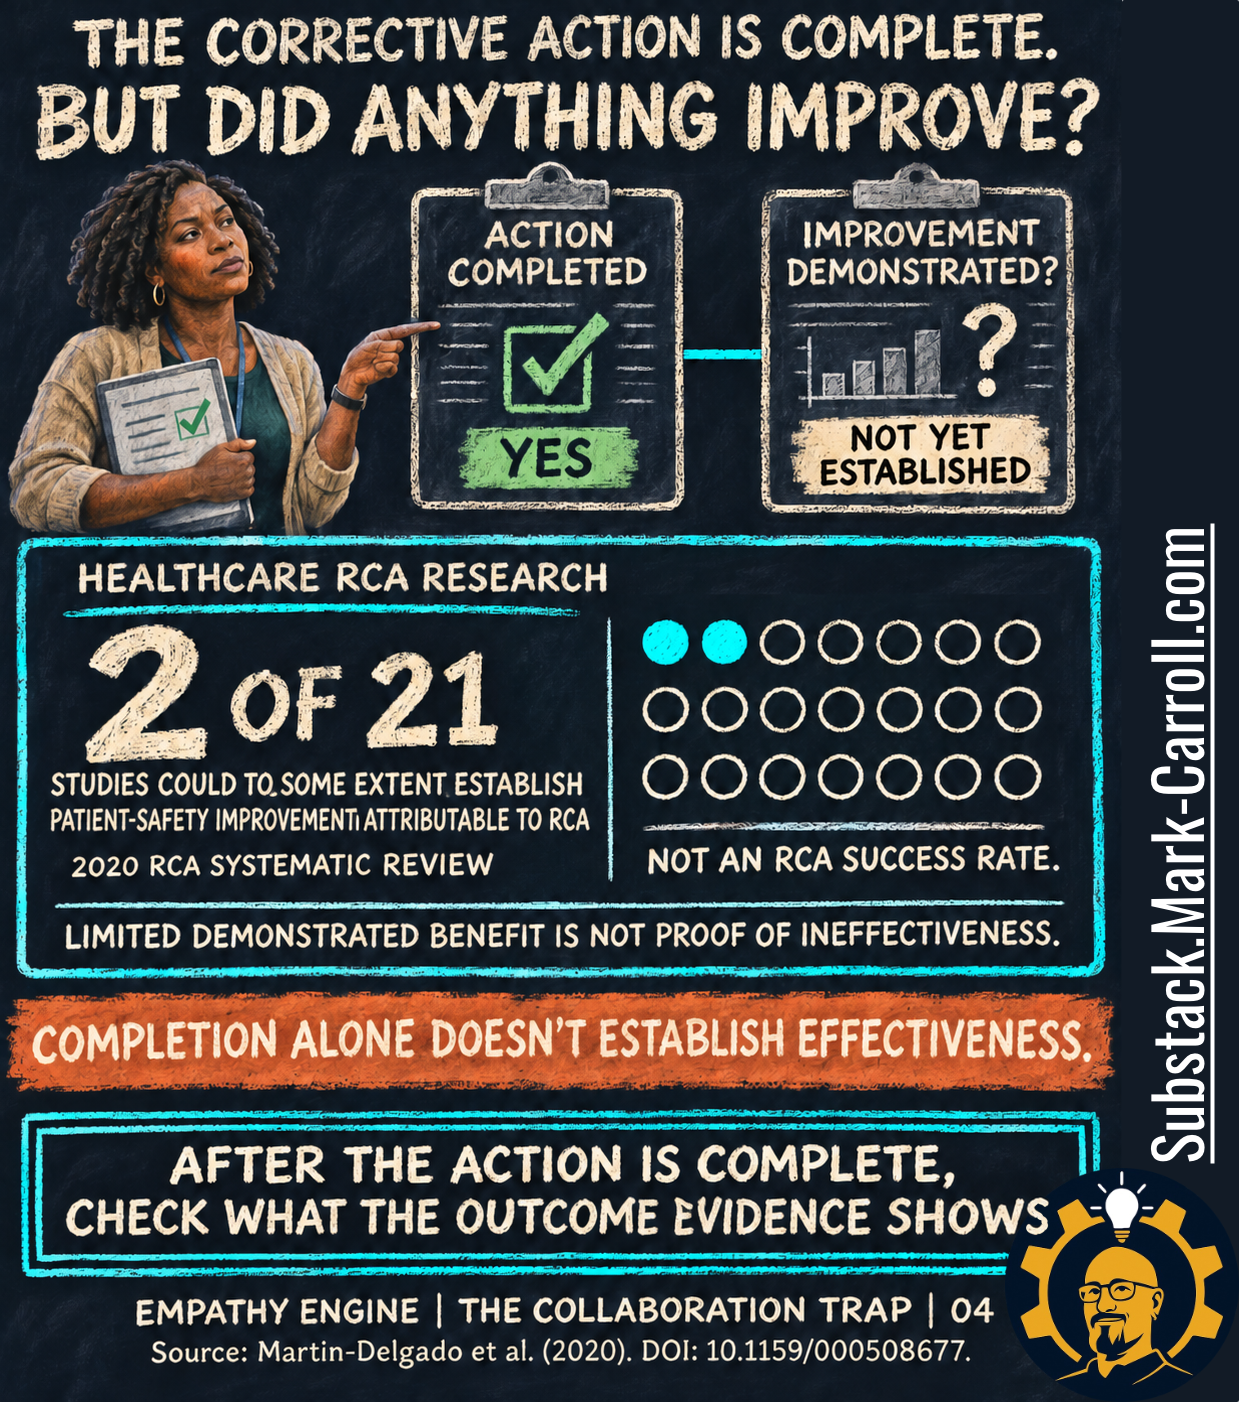
The two clipboards say it: action completed, yes. Improvement demonstrated, not yet established. Same pattern as the hero graphic, one stage later. A green status tells you the recorded work was done. It doesn’t tell you whether the change went in as designed, whether the intended outcome improved, or whether any improvement can be credited to the change.
The stat card is the most important number in this article, so let’s read it carefully.
In 2020, Jimmy Martin-Delgado and colleagues published a systematic review asking how much root cause analysis translates into improved patient safety. They included 21 studies, 18 of them in hospitals. Only 2 of 21 could, to some extent, establish a patient-safety improvement attributable to RCA. The authors concluded that RCA is useful for identifying causes, but that the evidence for it producing effective prevention is weak.
The two lines printed under that number matter as much as the number.
Not an RCA success rate. The 21 studies weren’t equivalent trials of one standardized method with a shared measure of success. Two of 21 doesn’t mean two RCAs in 21 worked.
Limited demonstrated benefit is not proof of ineffectiveness. This is the line I’d tattoo on the forearm of anyone who wants to use this study to say root cause analysis doesn’t work. Nor do the other 19 studies, taken together, show RCA failing. The review shows how hard it is to establish that investigative work and its recommendations produced the intended improvement.
The limits are real. This is healthcare research, not software incidents or partner order feeds. What transfers is the shape of the gap, not its size. Even in a field with formal investigation processes, completing the analysis and showing that the resulting action helped turned out to be different things.
And sometimes the evidence will support success. A corrective action can genuinely improve reliability. Verification isn’t about proving an action failed. It’s about finding out what the observations actually support.
That’s the orange banner again: completion alone doesn’t establish effectiveness. None of this means keeping the ticket open forever. It means not asking the ticket to prove something it was never designed to measure.
In practice, that’s one small habit at the end of every review. When the team chooses a corrective action, ask a second question before anyone leaves: “When it’s done, what would we expect to see, and when would we look?”
After the action is complete,
check what the outcome evidence shows.
Firefighting isn’t the villain
This is where a lot of articles reach for a story about hero culture: teams hooked on the adrenaline of the bridge call, leaders rewarding firefighters and ignoring fire marshals.
It’s a satisfying story. I believed a version of it when I started researching this piece. But I didn’t find evidence that successful recovery causes teams to neglect prevention. A team can recover brilliantly and investigate thoroughly. Plenty do.
There’s also a fair reason prevention work waits that has nothing to do with culture: sometimes the fix isn’t worth it yet. Valentina Lenarduzzi and colleagues reviewed research on how software teams prioritize technical debt, screening 557 papers and including 44 studies. They found many competing factors in those decisions and no validated, agreed method for weighing them. Deferring a fix can be a reasonable business choice. It’s still a choice, and it deserves an owner.
So the people in our story aren’t the problem. Omar did what a good engineer does at 6:12 in the morning. Renee ran a calm bridge. The review produced a reasonable action. What was missing was a question nobody owned: who decides what happens after the fix, and on what evidence?
Two guardrails before we go on. Don’t trade response for prevention. Nothing here argues for thinner on-call coverage, slower escalation, or fewer people who can restore service. You need both. Don’t turn this into blame. The questions ahead are for learning, not scoring people.
Which raises a fair objection. If reviewing incidents doesn’t guarantee improvement, should teams bother reviewing at all? The evidence says yes, emphatically, with one condition.
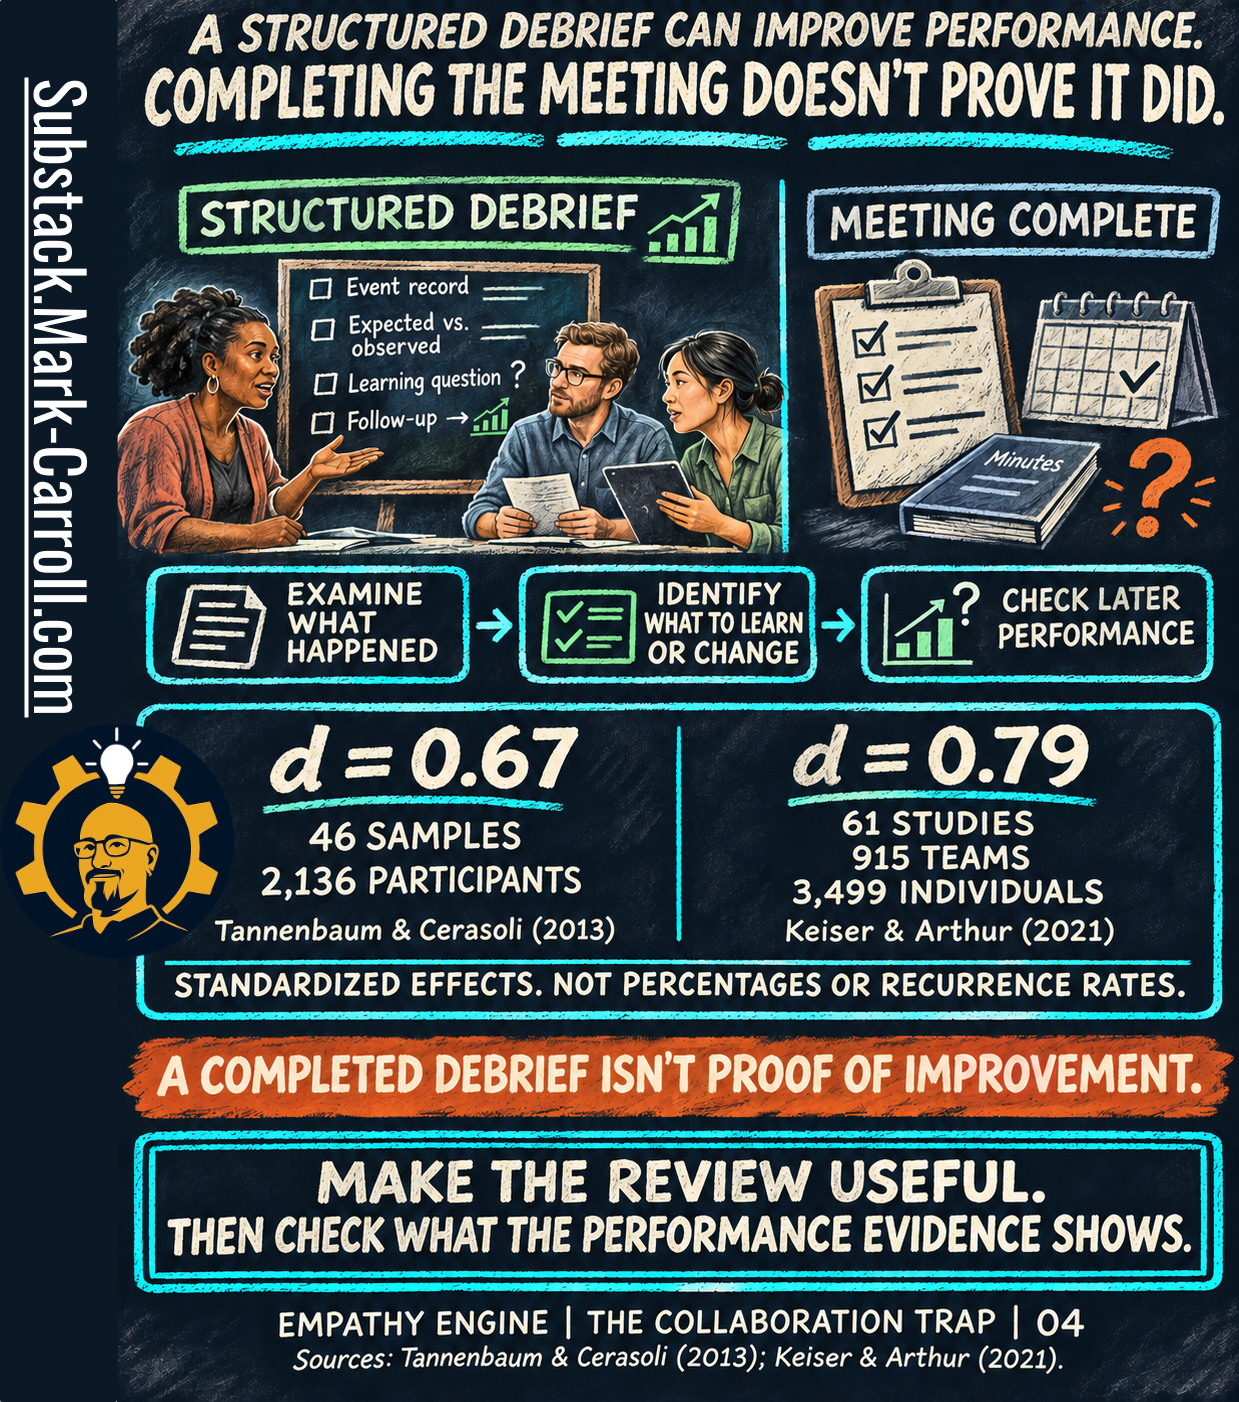
A structured debrief can improve performance. Completing the meeting doesn’t prove it did.
The evidence on structured reviews is some of the most encouraging research in this whole series.