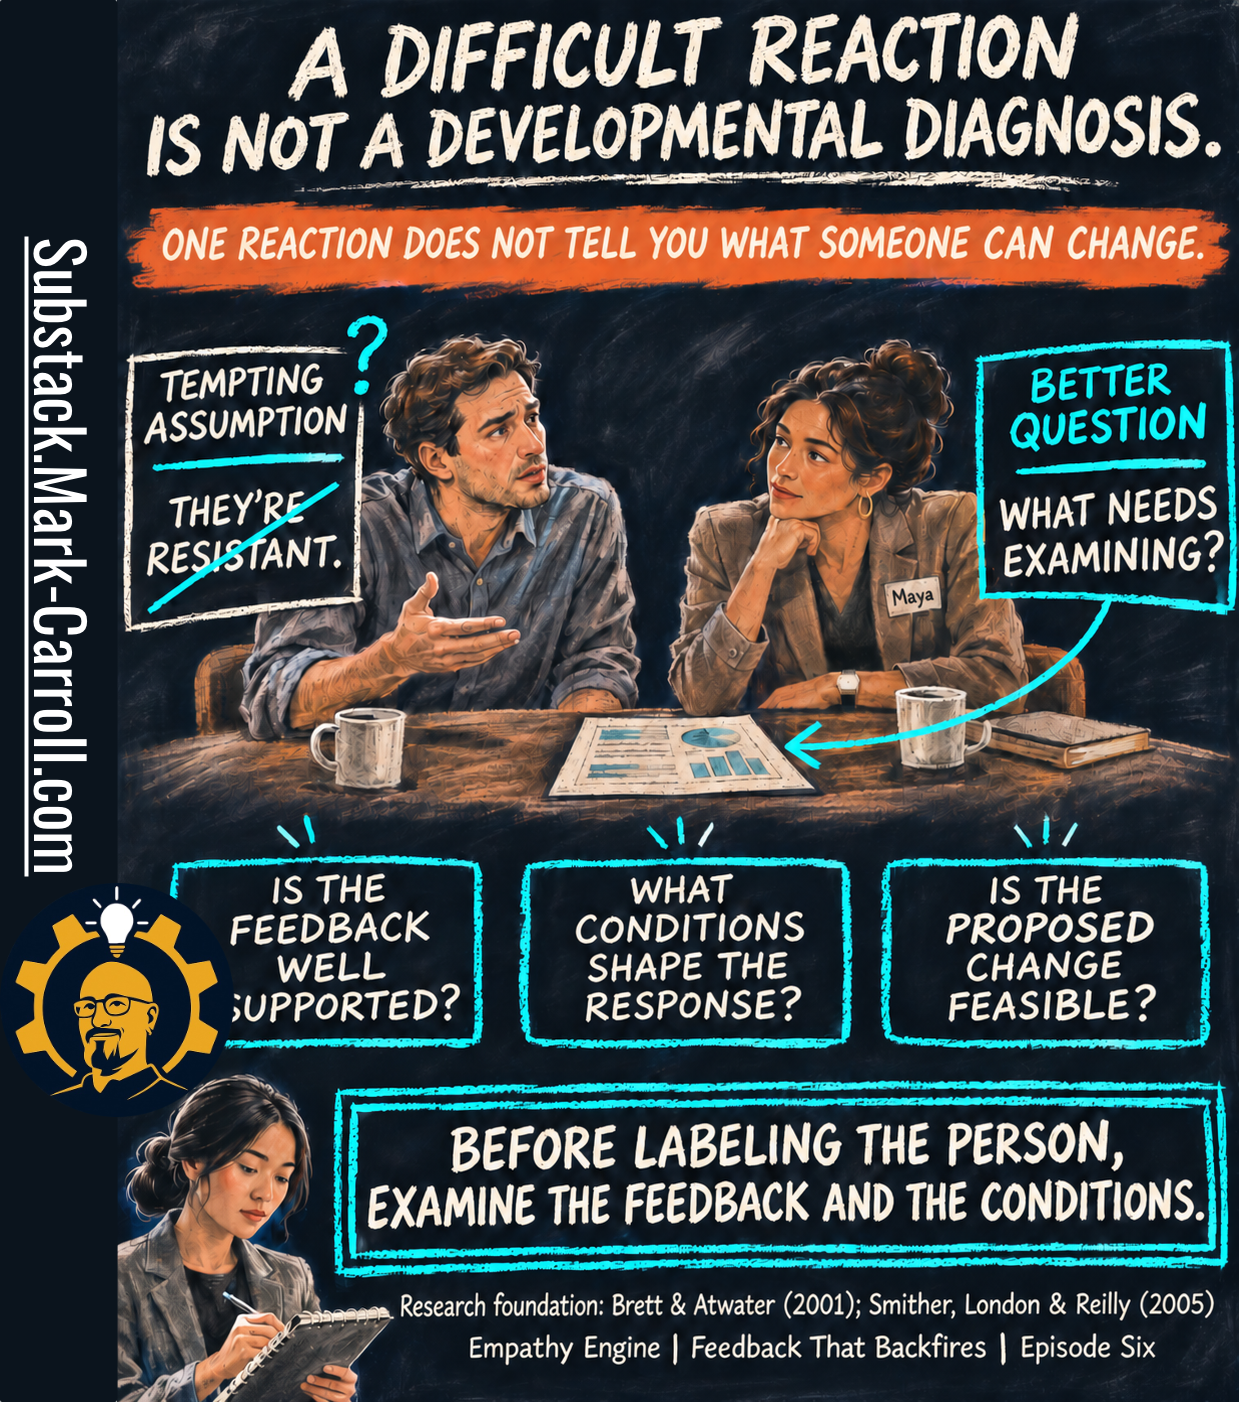
Twenty-six pages. Which sentence changes Monday?
👋 Welcome to my paid subscriber-only edition of Empathy Engine (🔒 Leader’s Dispatch). Each week I build evidence-forward tools for product leads who need to say no, defend tradeoffs, and lock in decisions before they get rewritten later.
The report was Dev’s, and so was the choice of who saw it. He forwarded the PDF to Maya on Thursday night with one line: “Before our Friday. Not sure what to do with this.”
Maya Chen opened it at her desk the next morning. (Maya and Dev are fictional, built to illustrate this series.)

It was his 360 report from the company’s leadership development program, a developmental exercise that sends each participant their own results. Twelve raters: one supervisor, seven peers and partners, and four analysts. Dev doesn’t have a formal team. But since he took over the segment forecasts in July, those four take their day-to-day direction from him, and the program counts them as his direct-report group.
Twenty-six pages. Bar charts by rater group, a self-versus-others gap table, and two pages of anonymous comments.
It looked thorough, and it was. HR had spent weeks collecting it. Twelve people had given it part of an afternoon. Every perspective around Dev’s work had been asked, and most had answered.
Maya read all twenty-six pages. Then she turned to a blank page in her notebook, wrote Monday at the top, and couldn’t think of what to write under it.
The most convincing illusion in organizational improvement is the one I can help create myself. I’ve seen how a thoroughly prepared assessment can make a room feel that meaningful progress has already occurred. The evidence is organized, the findings are presented, and everyone can point to something finished. As a coach, I’ve had to challenge my own temptation to count that completed work as the accomplishment. The report may be useful, even necessary, but it leaves me with a different question: What can anyone actually do differently on Monday?
Research Binder: the receipts, methodology notes, and source boundaries are compiled at the bottom of this post.
Previous:

Last week Maya handled one report from one stakeholder and learned that a concerning report is a reason to think, not permission to stop thinking. I promised that this week she would get a stack. Here it is, and the temptation is the same one in a bigger font.
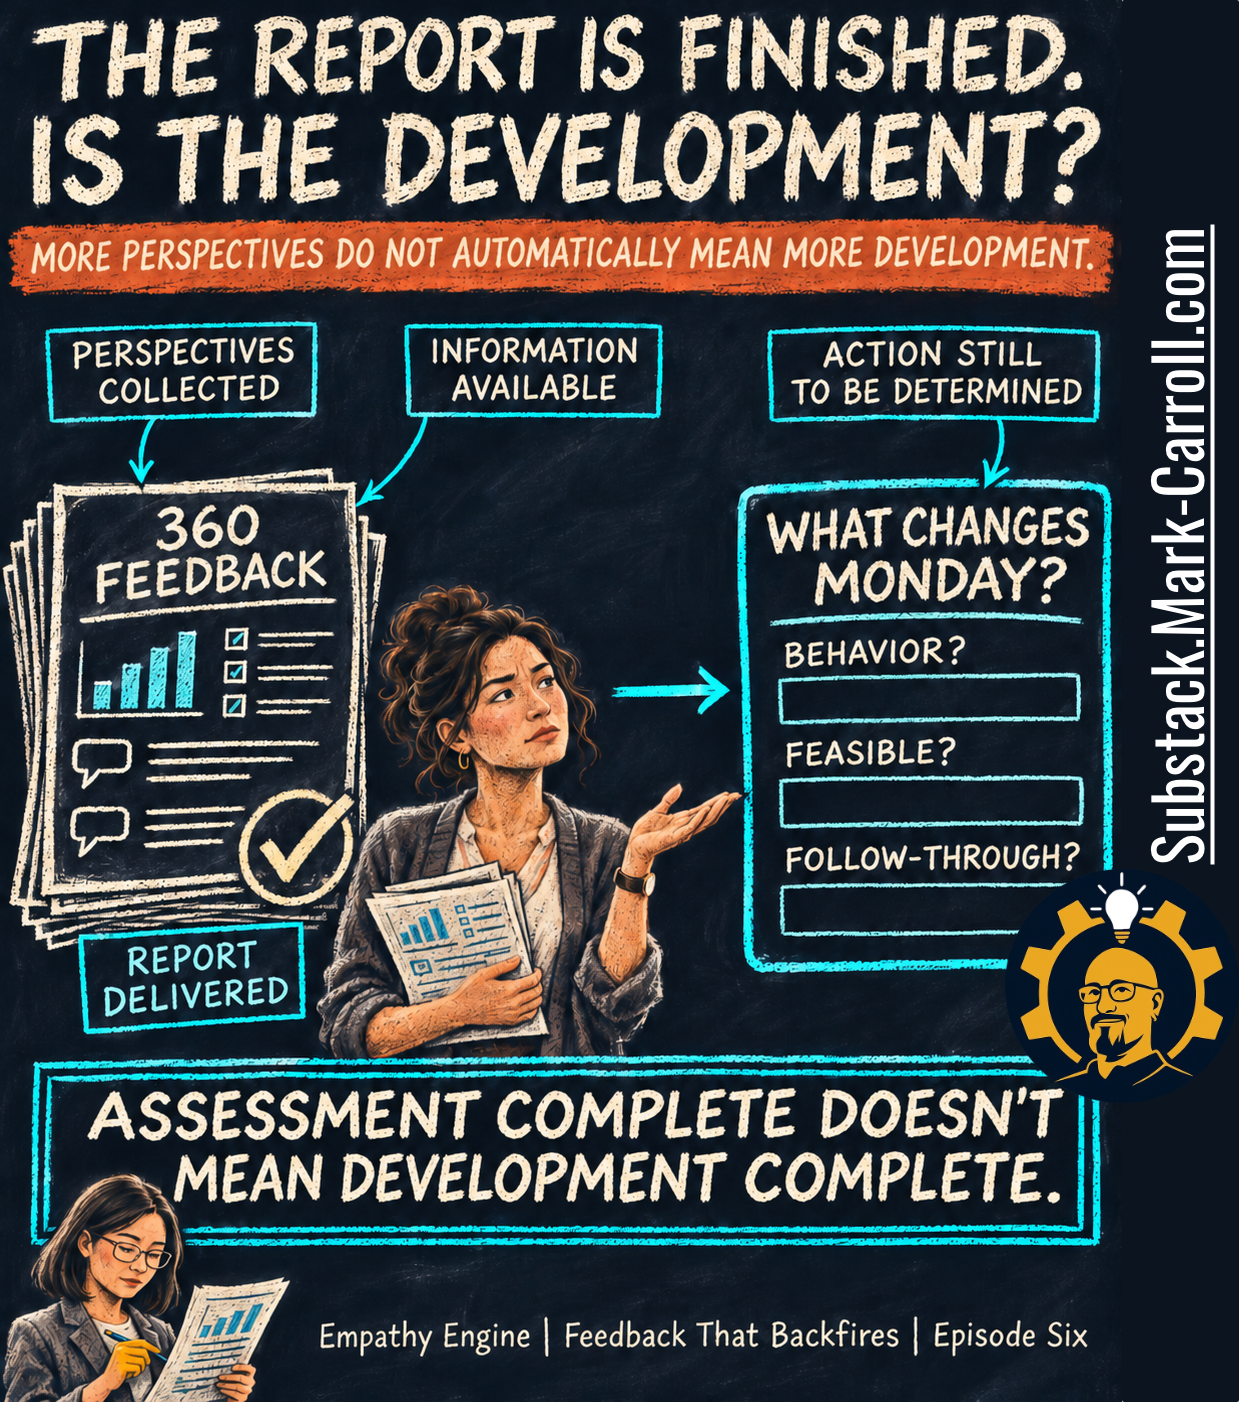
Look at what the left side of that page can honestly claim. Perspectives collected. Information available. Report delivered, with a check mark. All three are true of Dev’s PDF. They’re the something finished that everyone can point to, and all three describe the assessment.
The right side is the page in Maya’s notebook. Action still to be determined. What changes Monday? Under that question sit three empty boxes: Behavior? Feasible? Follow-through? The report didn’t fill any of them, and it was never built to. A 360 can tell you how twelve people rated him against a list of competencies. It can’t tell you which behavior should change, whether Dev can change it from where he sits, or who will notice if he does.
That’s the illusion in this episode’s title, the one I said I can help create. Nobody in it is being fooled by a bad report. A good report does the work. It’s organized, it’s presented, it’s done, and the room takes done for progress. So I want to be precise about it. The illusion isn’t that 360 feedback is useless. A multisource report can show something one observer would miss, and Dev’s does. The illusion is the quiet leap from the left side of the page to the right: more perspectives do not automatically mean more development.
Assessment complete doesn’t mean development complete. The rest of this episode is about the distance between those two, and what a manager can check before trying to cross it.
What improved depends on what was measured
Before the evidence, a vocabulary problem. It caught Maya before she finished her coffee.
The program’s kickoff email had promised “measurable growth at the six-month re-survey.” She had read that line in September and nodded. Reading it again with Dev’s report open, she noticed what a re-survey measures. It measures ratings. If Dev’s peer score on collaboration moves from 2.6 to 3.3 in May, the thing that will have changed, for certain, is a number that seven people typed into a form.
Maybe that number will move because Dev works differently.
Maybe it will move because his peers know he saw the last one.
Maybe a quiet quarter will do it. A rating can’t say which.
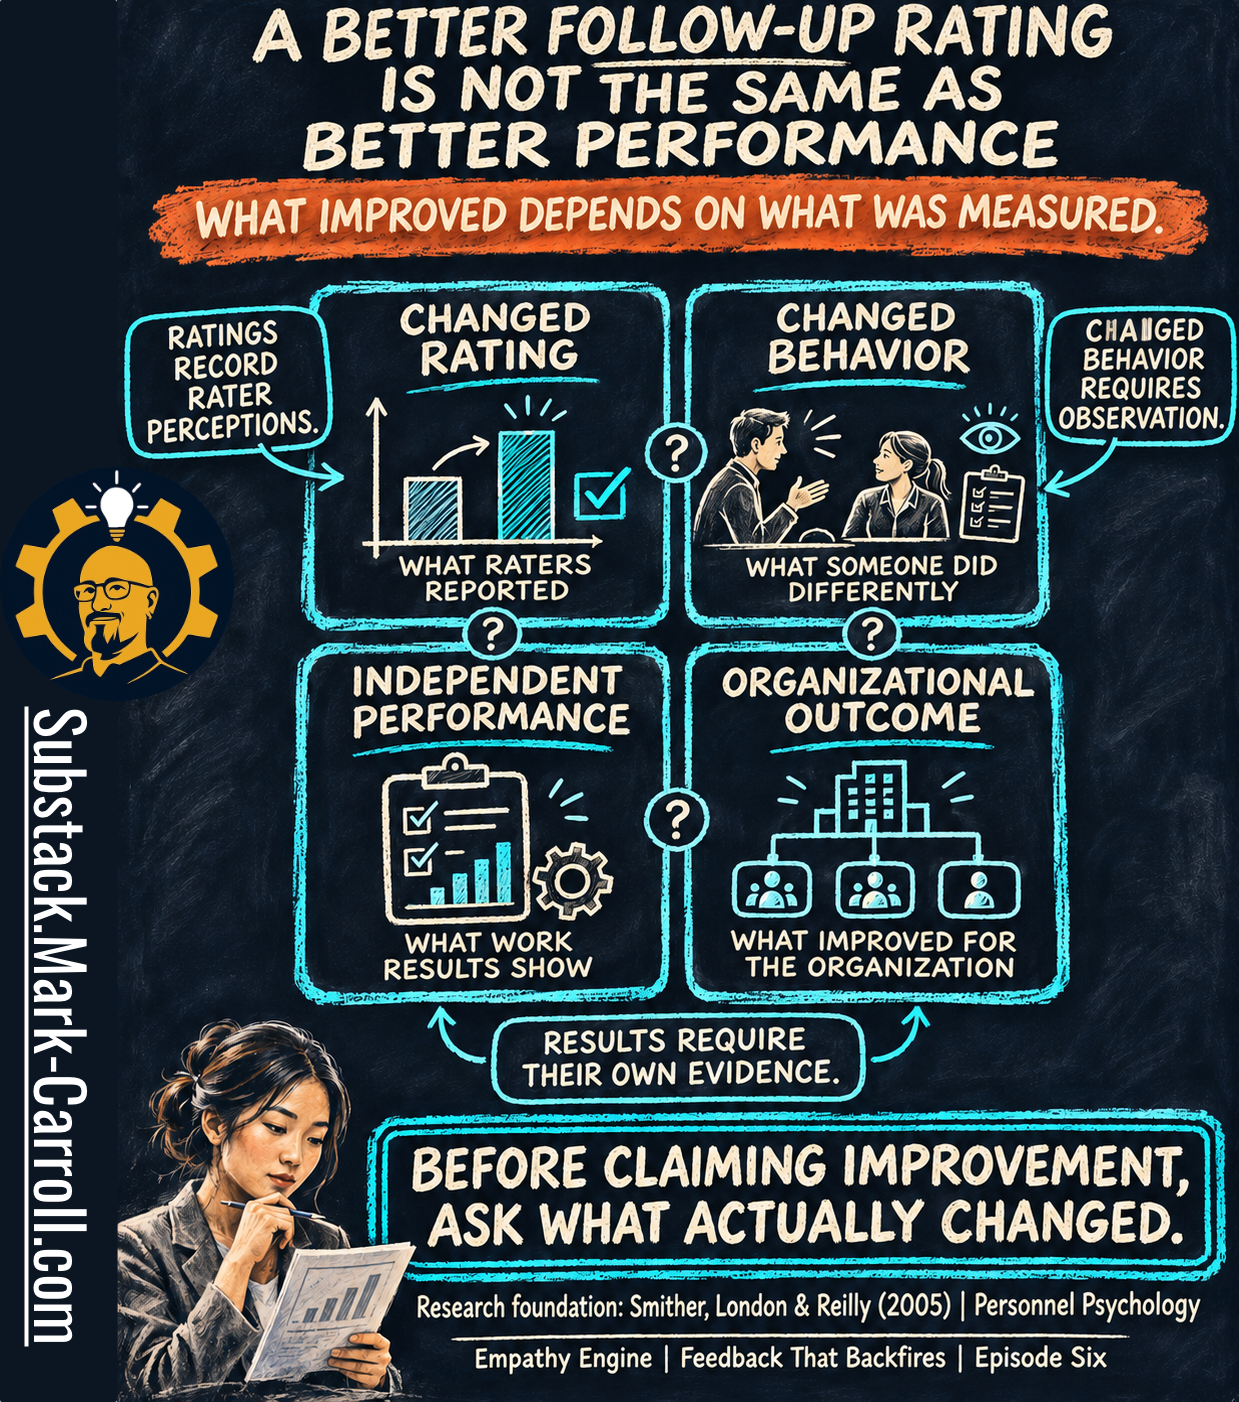
The infographic separates four things that get called “improvement” as if they were one.
Changed rating. What raters reported. Ratings record rater perceptions.
Changed behavior. What someone did differently. Changed behavior requires observation.
Independent performance. What work results show.
Organizational outcome. What improved for the organization.
Notice the question marks sitting between the boxes. They’re the point of the picture. A change in one box doesn’t carry you into the next one. A better rating may reflect better behavior, and better behavior may show up in the work, and better work may help the organization. Each “may” is a separate claim. As the callout at the bottom says, results require their own evidence.
This isn’t a complaint about ratings. A rating is real information about how someone’s work is experienced, and for some behaviors, the people on the receiving end are the best observers there are. And the gap runs both ways: someone’s work can improve without every rater being in a position to notice. The complaint is about the label. What improved depends on what was measured, and most of what we know about 360 feedback was measured in the first box.
So before claiming improvement, ask what actually changed. Hold on to that question, because the best research on 360 feedback needs it.
Twenty-four studies, one careful answer
Same counterweight as every week: feedback is not the villain of this series, and neither is the 360.
For five episodes that counterweight has been Kluger and DeNisi’s 1996 meta-analysis. This week it can’t do the job. That paper pooled feedback experiments of many kinds, and it was not a study of multisource programs. Its numbers don’t transfer to Dev’s PDF. The 360 has its own evidence.
In 2005, James Smither, Manuel London and Richard Reilly published a meta-analysis in Personnel Psychology that asked the question in its title: does performance improve following multisource feedback? They pooled 24 longitudinal studies, each following people from one round of ratings to a later one.
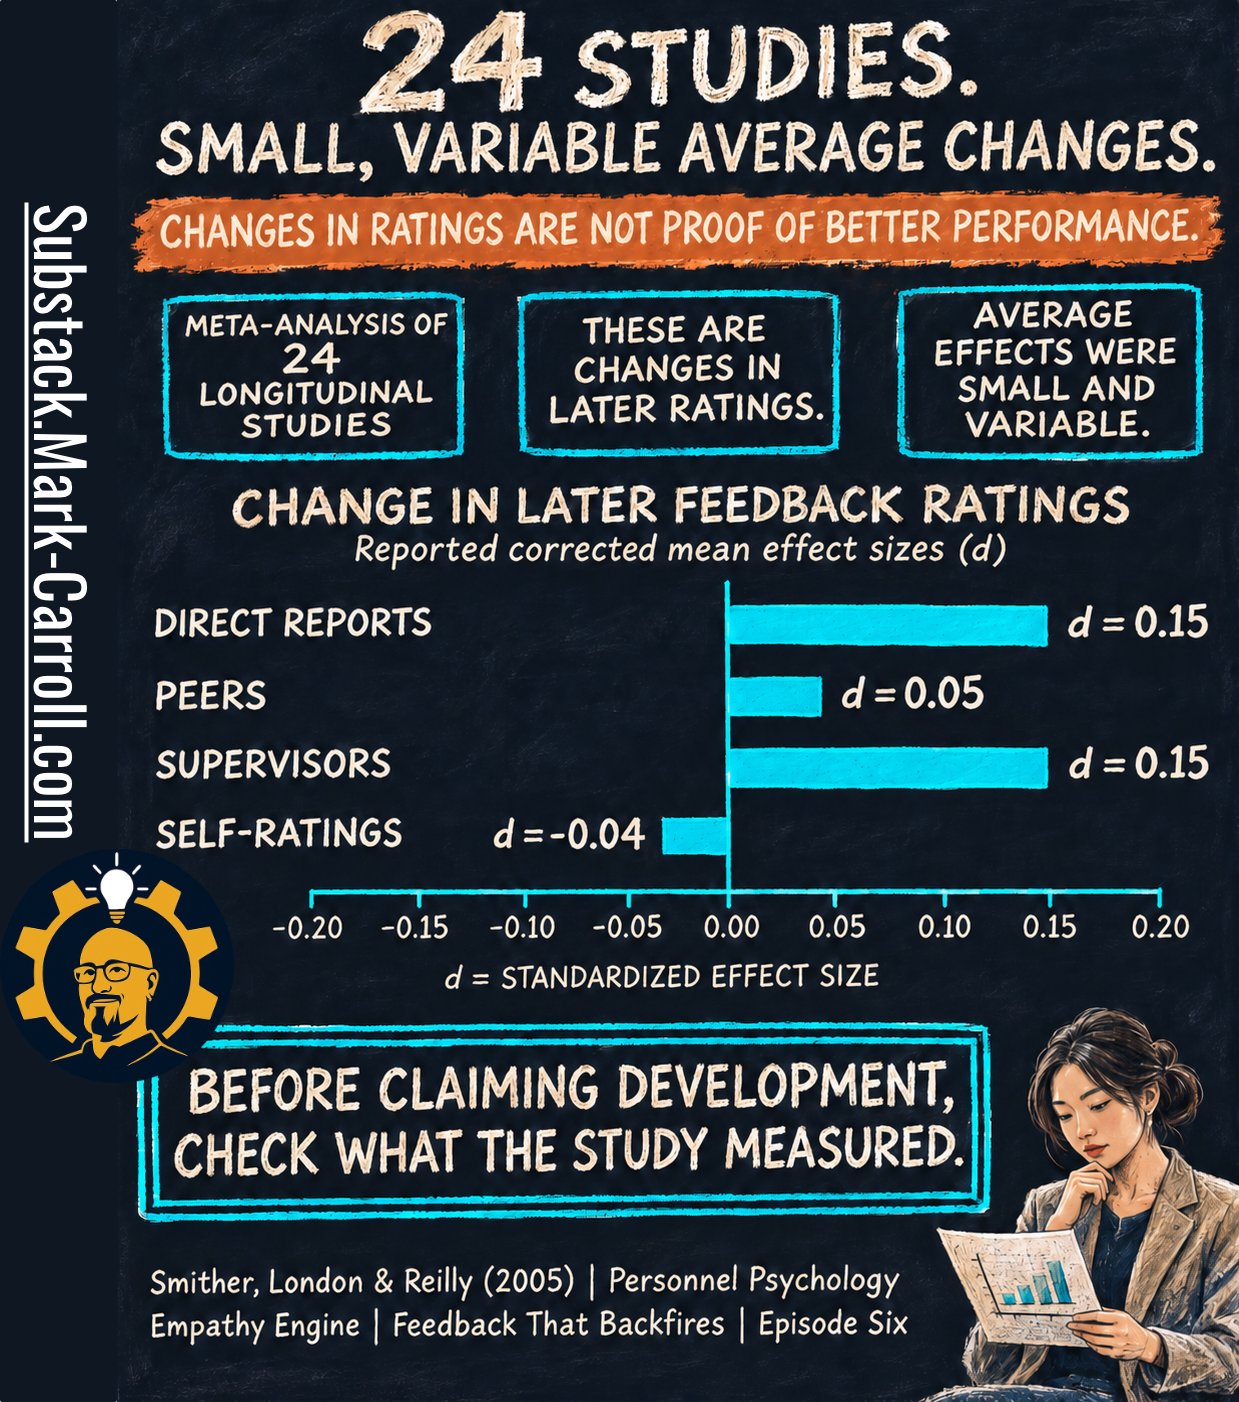
Read the chart title before the bars: change in later feedback ratings. That’s the first box from the last infographic. Then the bars, which show the reported corrected mean effect sizes.
Direct reports: d = 0.15
Peers: d = 0.05
Supervisors: d = 0.15
Self-ratings: d = -0.04
As the axis label says, d is a standardized effect size, the same shared ruler from Episode 1. A d of 0.15 isn’t a 15% improvement in anything. On that ruler these are small numbers, and the scale on the chart tops out at 0.20 for a reason.
The three boxes above the chart are the reading instructions. It’s a meta-analysis of 24 longitudinal studies. These are changes in later ratings. Average effects were small and variable.
“Small” and “variable” both matter, and they pull against the two lazy readings of this study.
Small doesn’t mean zero. Three of the four bars sit on the positive side. On average, the people around a 360 recipient rated them a little higher the next time. The authors didn’t conclude that multisource feedback fails. They concluded that practitioners shouldn’t expect large, widespread improvement from it.
Variable means the average hides a spread. A small average can sit on top of real improvement for some people and none for others. Some studies found more change, some less, and an average across studies can’t forecast one person. It can’t say what Dev’s next report will show, and it doesn’t describe how many programs “work.”
And the red banner holds the limit that matters most this week: changes in ratings are not proof of better performance. Most of what these 24 studies measured was the next round of ratings. Whether behavior changed, whether the work got better, and whether the organization gained anything are different boxes that need their own evidence. The study is also twenty-one years old. It remains the foundational direct evidence on the question.
The same paper offered a model of when improvement is more likely: when the feedback indicates change is needed, and when recipients see that need, react positively, believe change is feasible, set appropriate goals and take action. Treat that as the authors’ model, supported unevenly across studies, not as a recipe. I mention it now because every item on that list comes after the report. None of them is in the PDF.
Before claiming development, check what the study measured. Then check what your own program measures. For most of us, it’s the first box.
Twelve raters, one open question
Maya’s first instinct with Dev’s report was to trust it more because of its size. Twelve raters is a lot of people. One stakeholder at an elevator can be wrong. Twelve people filling in the same form felt like a different kind of evidence.
Part of that instinct is sound, and I don’t want to talk anyone out of the sound part.
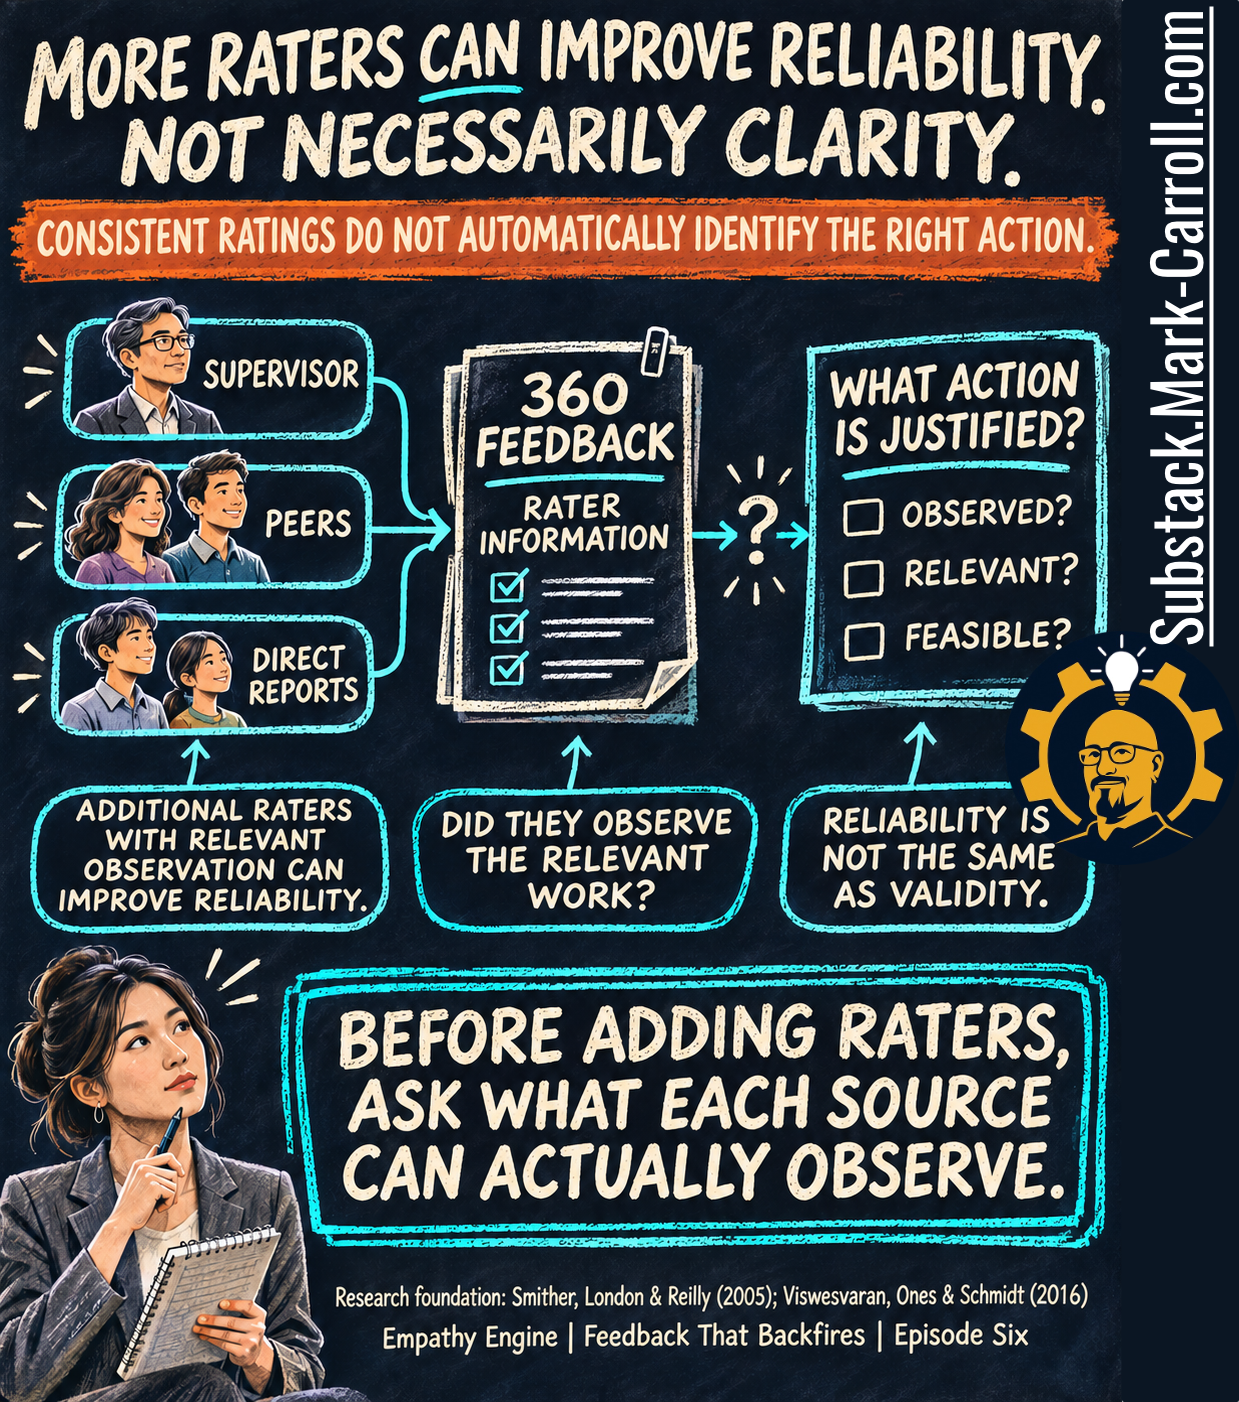
Start with the underlined word in the headline: can. More raters can improve reliability. One rater’s score carries a lot of that one rater. Average several people who watched the same work and the individual quirks start to wash out, so the score gets steadier. The first callout carries the condition that makes this true: additional raters with relevant observation can improve reliability.
That condition is the second callout, phrased as a question. Did they observe the relevant work? Seven peers rated Dev on “develops others.” Maya couldn’t think of a setting where most of them would have seen him do it. Adding a rater who never watched the behavior adds a number. It doesn’t add an observation. No universal rater count settles this, either. How many raters protect confidentiality, how many steady a score, and how many could see the work are three separate questions.
The third callout is the one I’d tape to the monitor: reliability is not the same as validity. Reliability is about consistency: how much of a score holds steady across raters and occasions, and how much depends on who happened to be asked. Validity means the score reflects the thing it’s supposed to reflect. Twelve people can agree, steadily and sincerely, and still be describing their shared impression rather than the behavior on the form. Chockalingam Viswesvaran, Deniz Ones and Frank Schmidt make a related argument in a 2016 commentary on comparing rater groups: before you interpret a difference, you have to work out how much of it is unreliability and how much is real disagreement about the person’s work. Theirs is a methodological argument, not a tested debrief method.
Now follow the arrows across the middle of the infographic. Supervisor, peers and direct reports feed the report. The report holds rater information. Then comes a question mark, and only then the box on the right: what action is justified? Under it sit three unticked boxes. Observed? Relevant? Feasible?
That question mark is where Maya was sitting on Friday morning. The red banner says why a steadier score didn’t move her off it: consistent ratings do not automatically identify the right action. Suppose all seven peers agree that Dev’s collaboration is a 2.6. The agreement tells Maya the perception is shared. It doesn’t tell her what they saw, whether it’s the part of the work that matters most, or whether Dev controls it.
So I’ve dropped a claim I expected to make this week. More raters don’t create more noise. The research I found doesn’t support that, and some of it points the other way. The defensible version is narrower: more perspectives can steady the score without clearing up the decision.
Before adding raters, ask what each source can actually observe. For a report that’s already printed, ask it of each rater group in turn. That’s where Dev’s report got interesting.
Three groups, three scores
Dev’s lowest competency was collaboration, at 3.2 out of 5 across all raters. That single number was the least useful thing on the page. Underneath it, the report split the score by rater group.
Supervisor: 3.0
Peers and partners: 2.6
Analysts he directs: 4.4
The same person, the same competency, the same month. One group put him near the bottom of the scale and another near the top.
Maya’s mind went straight to a ruling. The peers work with him across functions, so they’d know. Or the analysts work with him every day, so they’d know. Either way, somebody had to be right, and the average of 3.2 was sitting there as if it had already settled the argument by splitting the difference.
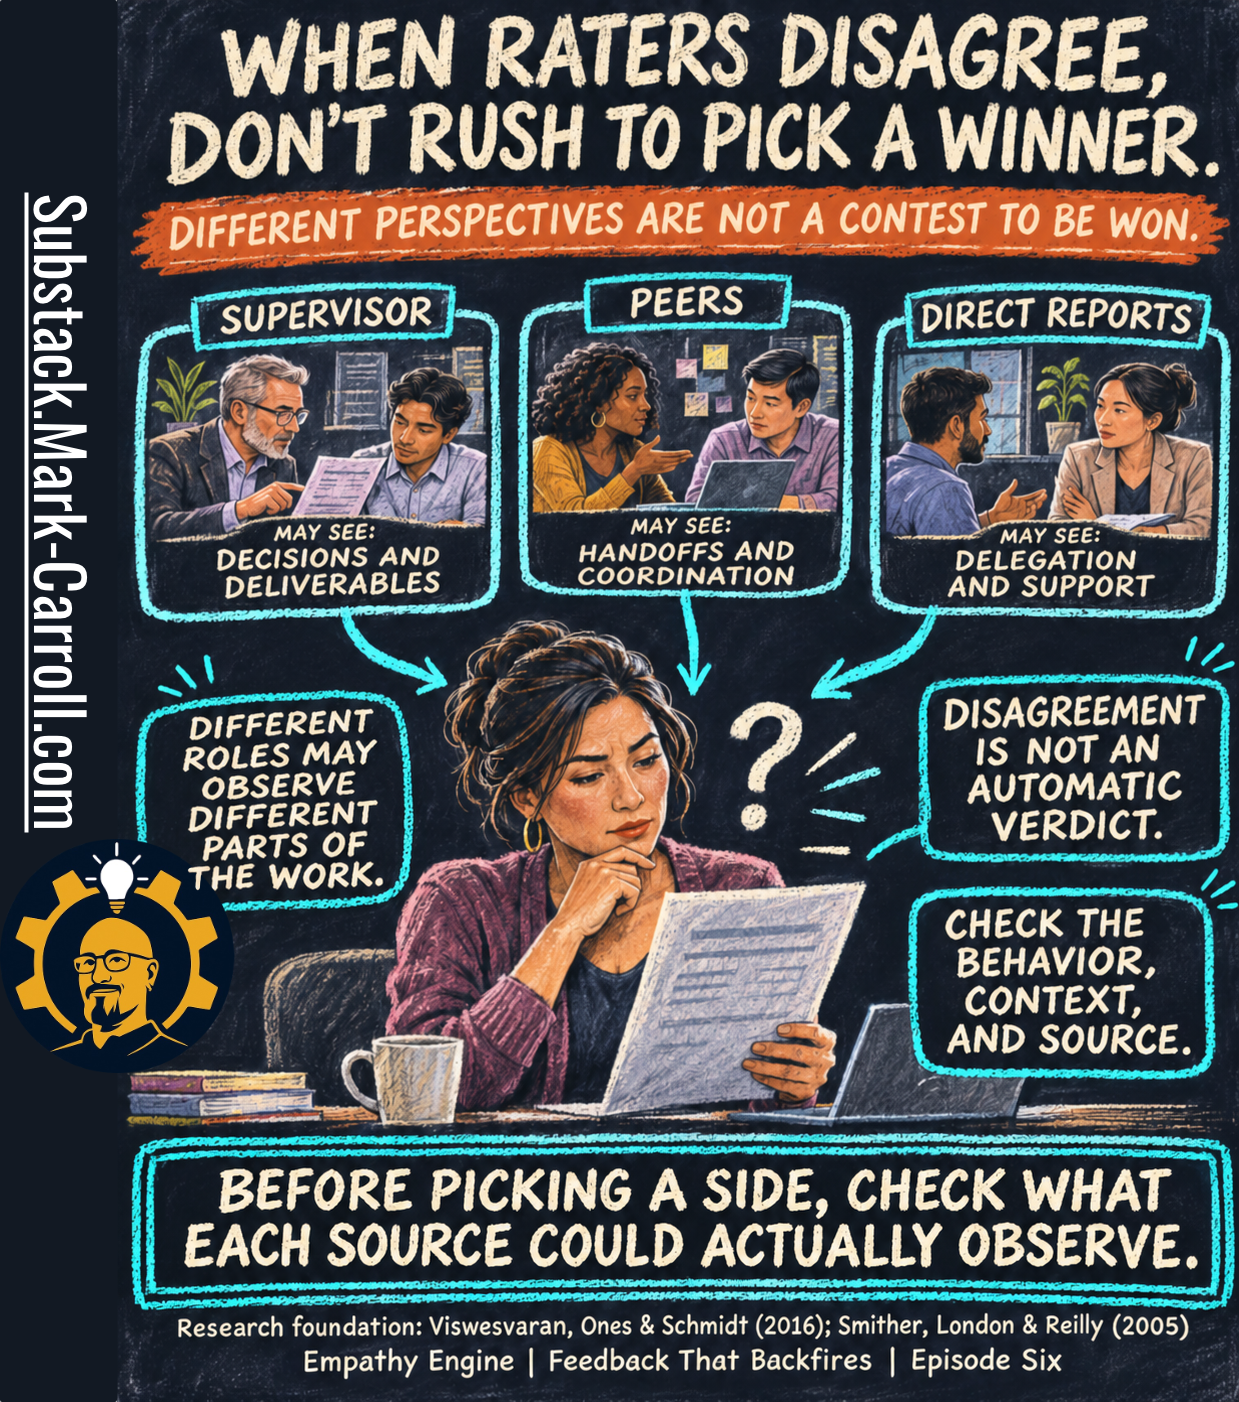
The three panels across the top give a different way to read that table. Each group has a window onto the work, and the windows aren’t the same.
Supervisor. May see decisions and deliverables.
Peers. May see handoffs and coordination.
Direct reports. May see delegation and support.
The word doing the work in every panel is may. These are typical vantage points, not a rule about who sees what, and you have to check them against the actual job. For Dev they fit closely. The four analysts get his time, his explanations and his review comments. The peers in commercial get his forecasts, and sometimes a changed number with no warning. Both groups could be describing exactly what they see.
That’s the first callout: different roles may observe different parts of the work. On that reading, 2.6 and 4.4 aren’t two measurements of one thing with an error between them. They may be two accurate reports about two different parts of the job. Viswesvaran, Ones and Schmidt make this distinction the center of their 2016 commentary: a gap between rater groups can be unreliability, or it can be real, construct-level disagreement, and the two call for different responses.
The second callout keeps that from turning into a new shortcut. Disagreement is not an automatic verdict. It doesn’t prove the low group is biased, and it doesn’t prove the high group is being kind. Different vantage points are one explanation. Different standards are another. So are a small group, a recent bad week, or raters who never saw the behavior. A group score isn’t a unanimous one, either. Seven peers averaging 2.6 could be seven mildly frustrated people, or three very unhappy ones and four who are fine. The report can’t tell these apart. As the red banner puts it, different perspectives are not a contest to be won, so Maya doesn’t need to crown one.
Then there was the supervisor line. The 3.0 was hers. She had entered it in October, the week after the regional splits went out unmarked, and before she had told Dev that a split counts as a new definition. Her rating recorded how his work looked to her that week, from her window, under a standard she hadn’t finished stating. It belongs in the report. It isn’t a neutral reading of his collaboration, and she is not a referee standing outside the table. She’s a row in it. She had helped draw the picture she was now trying to read.
The third callout is the working instruction: check the behavior, context, and source. Which behavior did the item ask about? In what situations would this group have seen it? What could this source observe, and what couldn’t it?
Before picking a side, check what each source could actually observe. Maya wrote the three group scores on her notebook page and put a question beside each one instead of a conclusion. Then Dev knocked on the door.
“Who wrote that?”
Dev sat down, opened his laptop to page nineteen and turned it toward her. One comment was highlighted.
“Great with his own team. The rest of us find out about changes when the deck is already on screen.”
“Who wrote that?” he said. “Because the changes come from them. They move the segments at four o’clock, I rebuild overnight, and then they score me on communication.” He scrolled to the peer bar. “Two point six. From the people who cause it.”
A sentence arrived in Maya’s head fully formed: he’s being defensive. It was ready to go into her notes as an explanation for whatever happened next.