The $800K review mistake: 12 signals, 14 days, done
🔒 Leader's Dispatch: Volume 29 (Chaos Agents, Part 3 of 3 Part Series)

Top of Series:

Previous:

The 12 warning signs your best employee is actually a chaos agent (and the 14-day protocol that stops them)
I spent the last three months talking to 15 engineering leaders, VPs of Product, and startup founders about their worst hiring mistakes. Not the people who were obviously bad—the ones who seemed great at first.
Every single conversation followed the same pattern: “They were our top performer for six months. Then suddenly, half the team wanted to quit.”
Here’s what I learned about toxic high performers, why they’re so hard to spot, and the measurement system that catches them before they cost you your best people.
The $800K mistake nobody saw coming
Last year, a Series B SaaS company (I’ll call them “DataFlow”) had their best PM quit with no warning. Exit interview reason: “I can’t work with Alex anymore.”
Alex was their star product designer. Shipped faster than anyone. Always said yes. The CEO’s go-to person for urgent work.
Within 60 days, two more people left. Same reason.
The VP of Product finally did the math:
6 months of degraded team velocity
3 high performers lost (recruiting + onboarding + ramp time)
4 projects that needed complete rework because Alex worked in silos
Total cost: $800K in lost productivity and hiring costs
The kicker? Leadership had seen the warning signs for months. They just didn’t have a framework to make them visible.
“Looking back, the signals were obvious,” the VP told me. “But when someone is delivering, you tell yourself the team issues are just ‘personality conflicts.’ That’s the trap.”
The pattern I keep seeing
Of the 15 leaders I interviewed, 11 had dealt with what I’m calling a “chaos agent”—a high performer whose individual output comes at severe cost to the team.
The pattern is always the same:
Month 1-3: Wow, this person ships fast. Month 4-6: Hmm, they seem to need a lot of exceptions. Month 7-9: Wait, why is everyone routing work through them? Month 10-12: Our best people are leaving and we don’t know why.
By the time leadership acts, the damage is structural. The team has adapted around the chaos. Silence is rewarded. Exception-making is normalized.
Here’s what surprised me most: The problem isn’t usually the person. It’s the measurement gap.
Leaders operate on vibes until it’s too late. They need metrics that make patterns visible before they become culture.
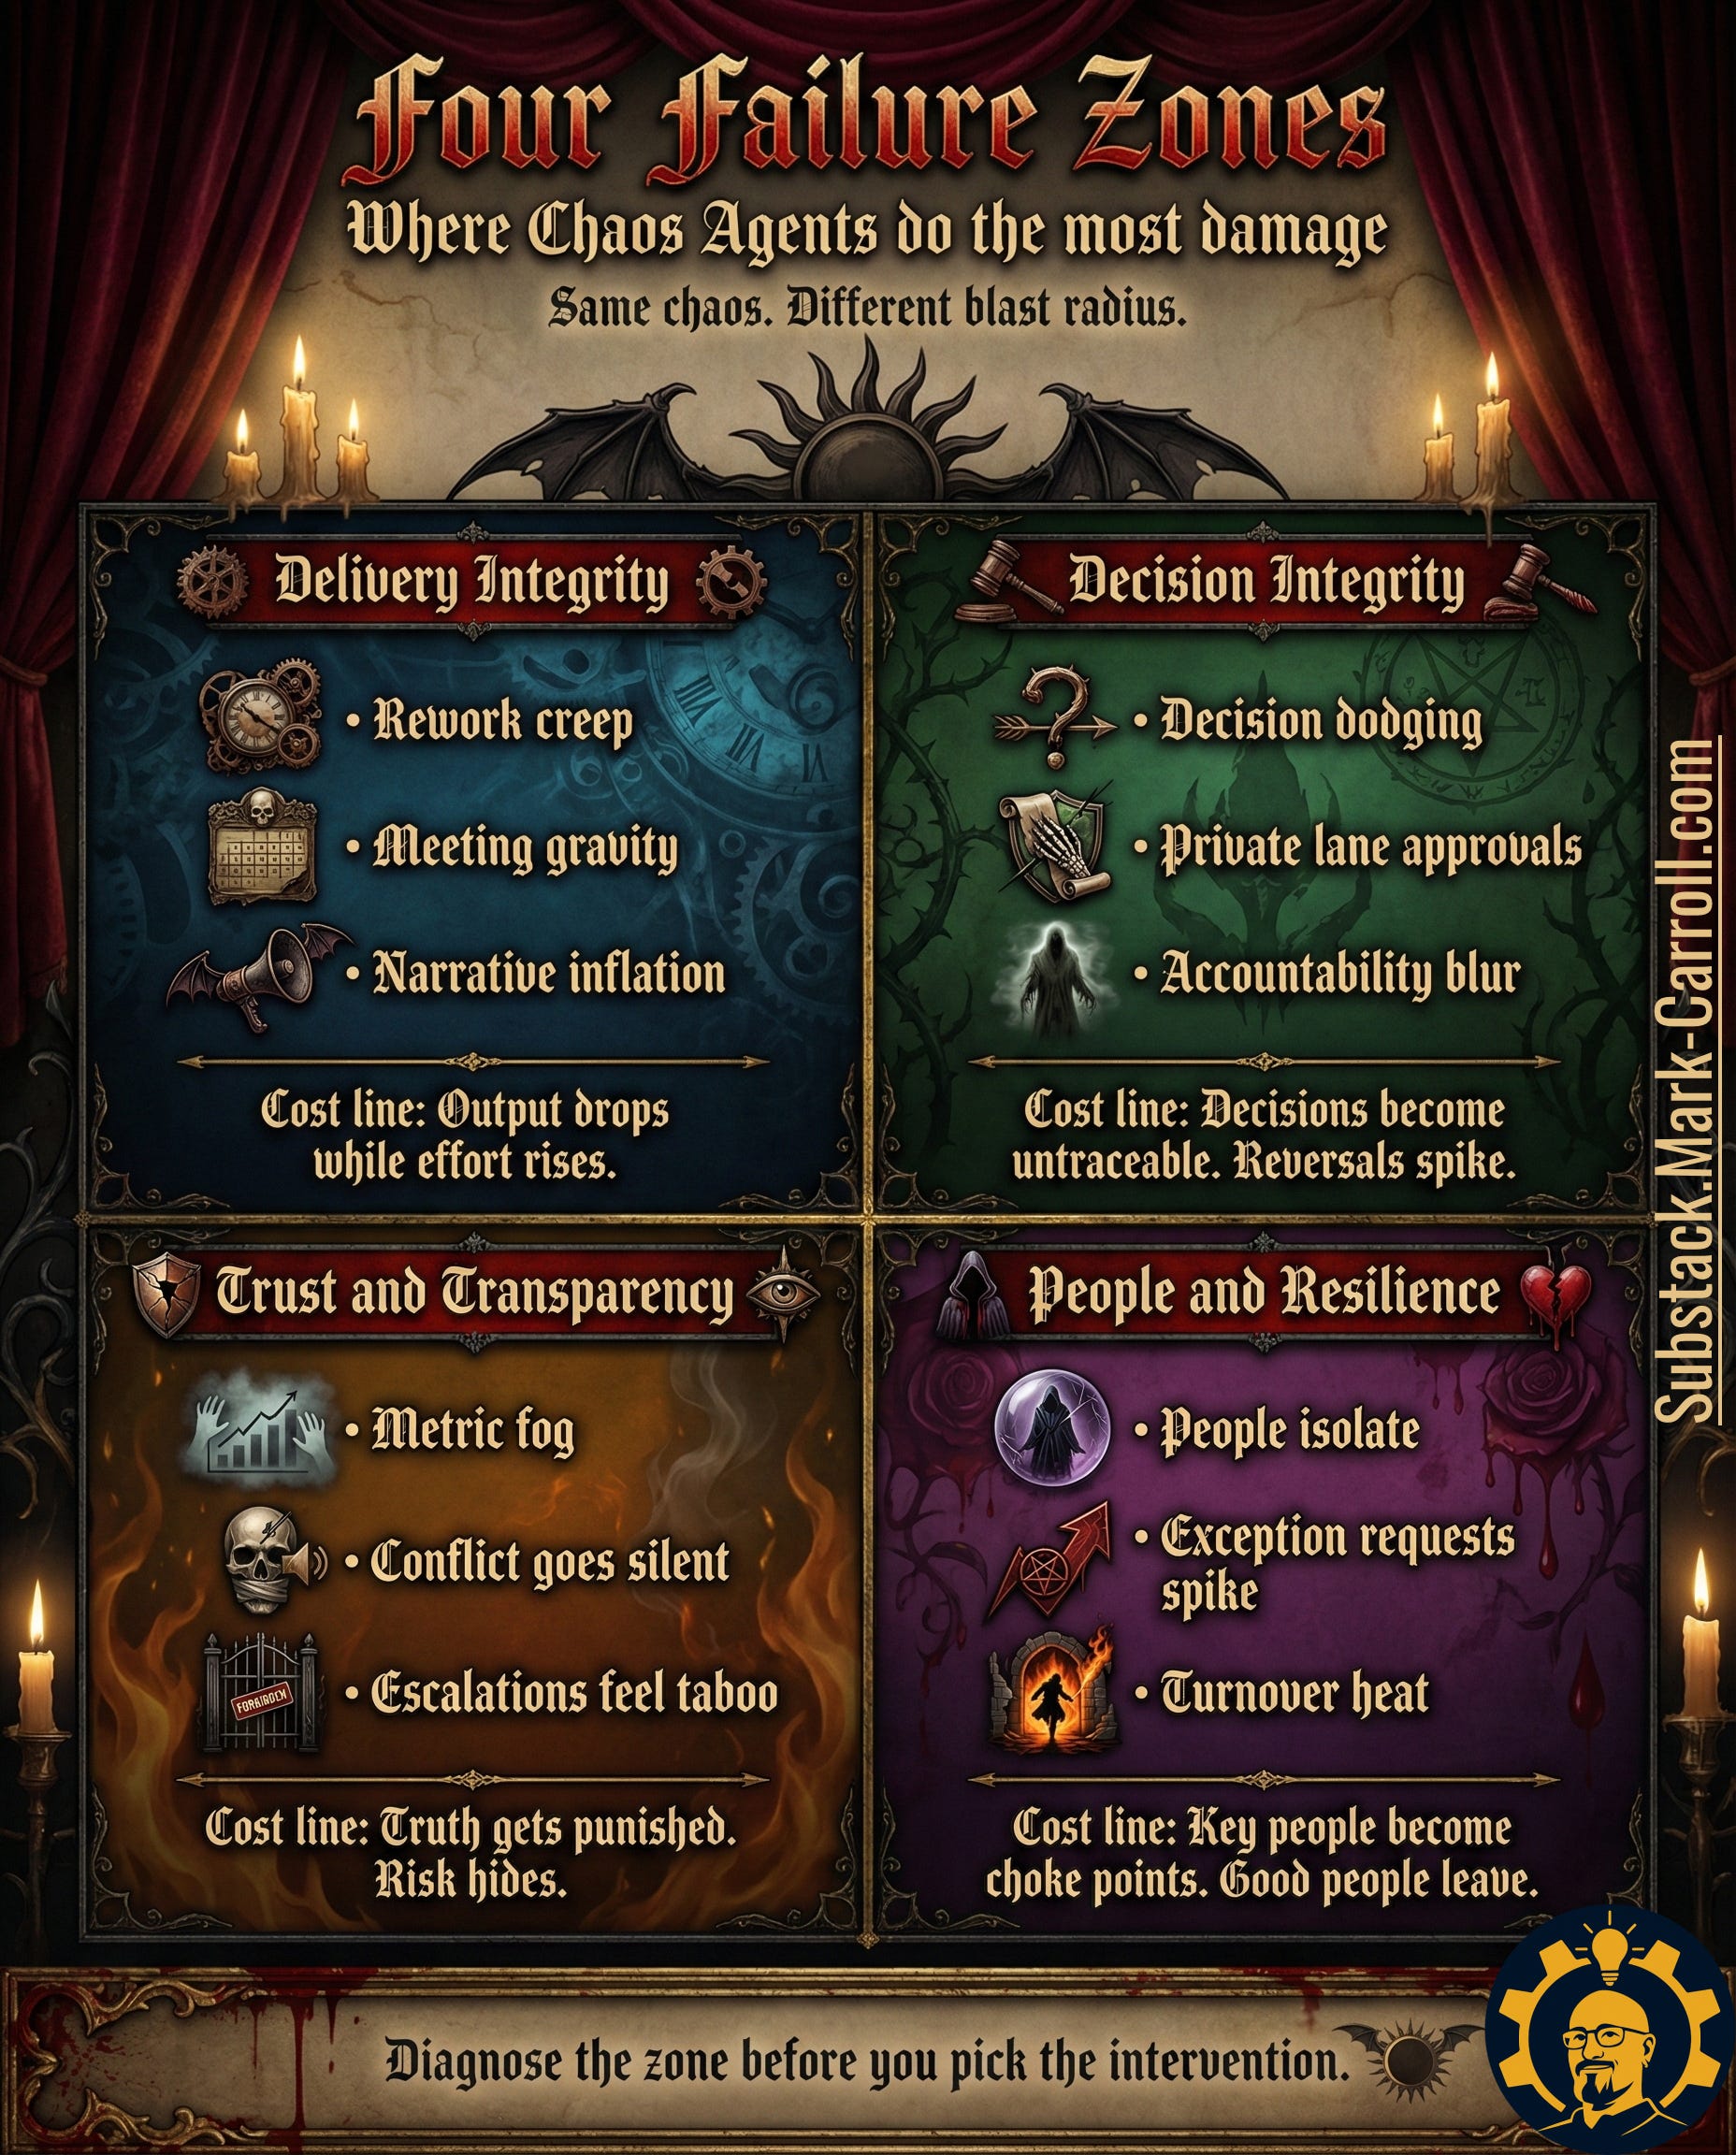
The Chaos Detection Framework: 4 zones, 12 signals
After reviewing incident reports from 8 companies and interviewing 4 organizational psychologists, I mapped out where dysfunction shows up first.
THE FOUR FAILURE ZONES
                    PROCESS LAYER          PEOPLE LAYER

EXECUTION       Decision Integrity      Delivery Integrity
                (clarity breaks)        (output breaks)

CULTURE         Trust & Transparency    People & Resilience
                (truth breaks)          (retention breaks)
Most leaders only measure the top-right (delivery). By then, the damage has spread to all four quadrants.
Let me break down each zone with the early signals that actually predict breakdown.
Zone 1: Decision Integrity (when clarity breaks)
What an engineering director at a fintech told me:
“We had a tech lead who was brilliant individually. But I started noticing decisions would get made in Slack DMs, then reversed in meetings, then un-reversed in hallway conversations. Nobody knew what was actually decided. That went on for four months before I realized it was always the same person at the center.”
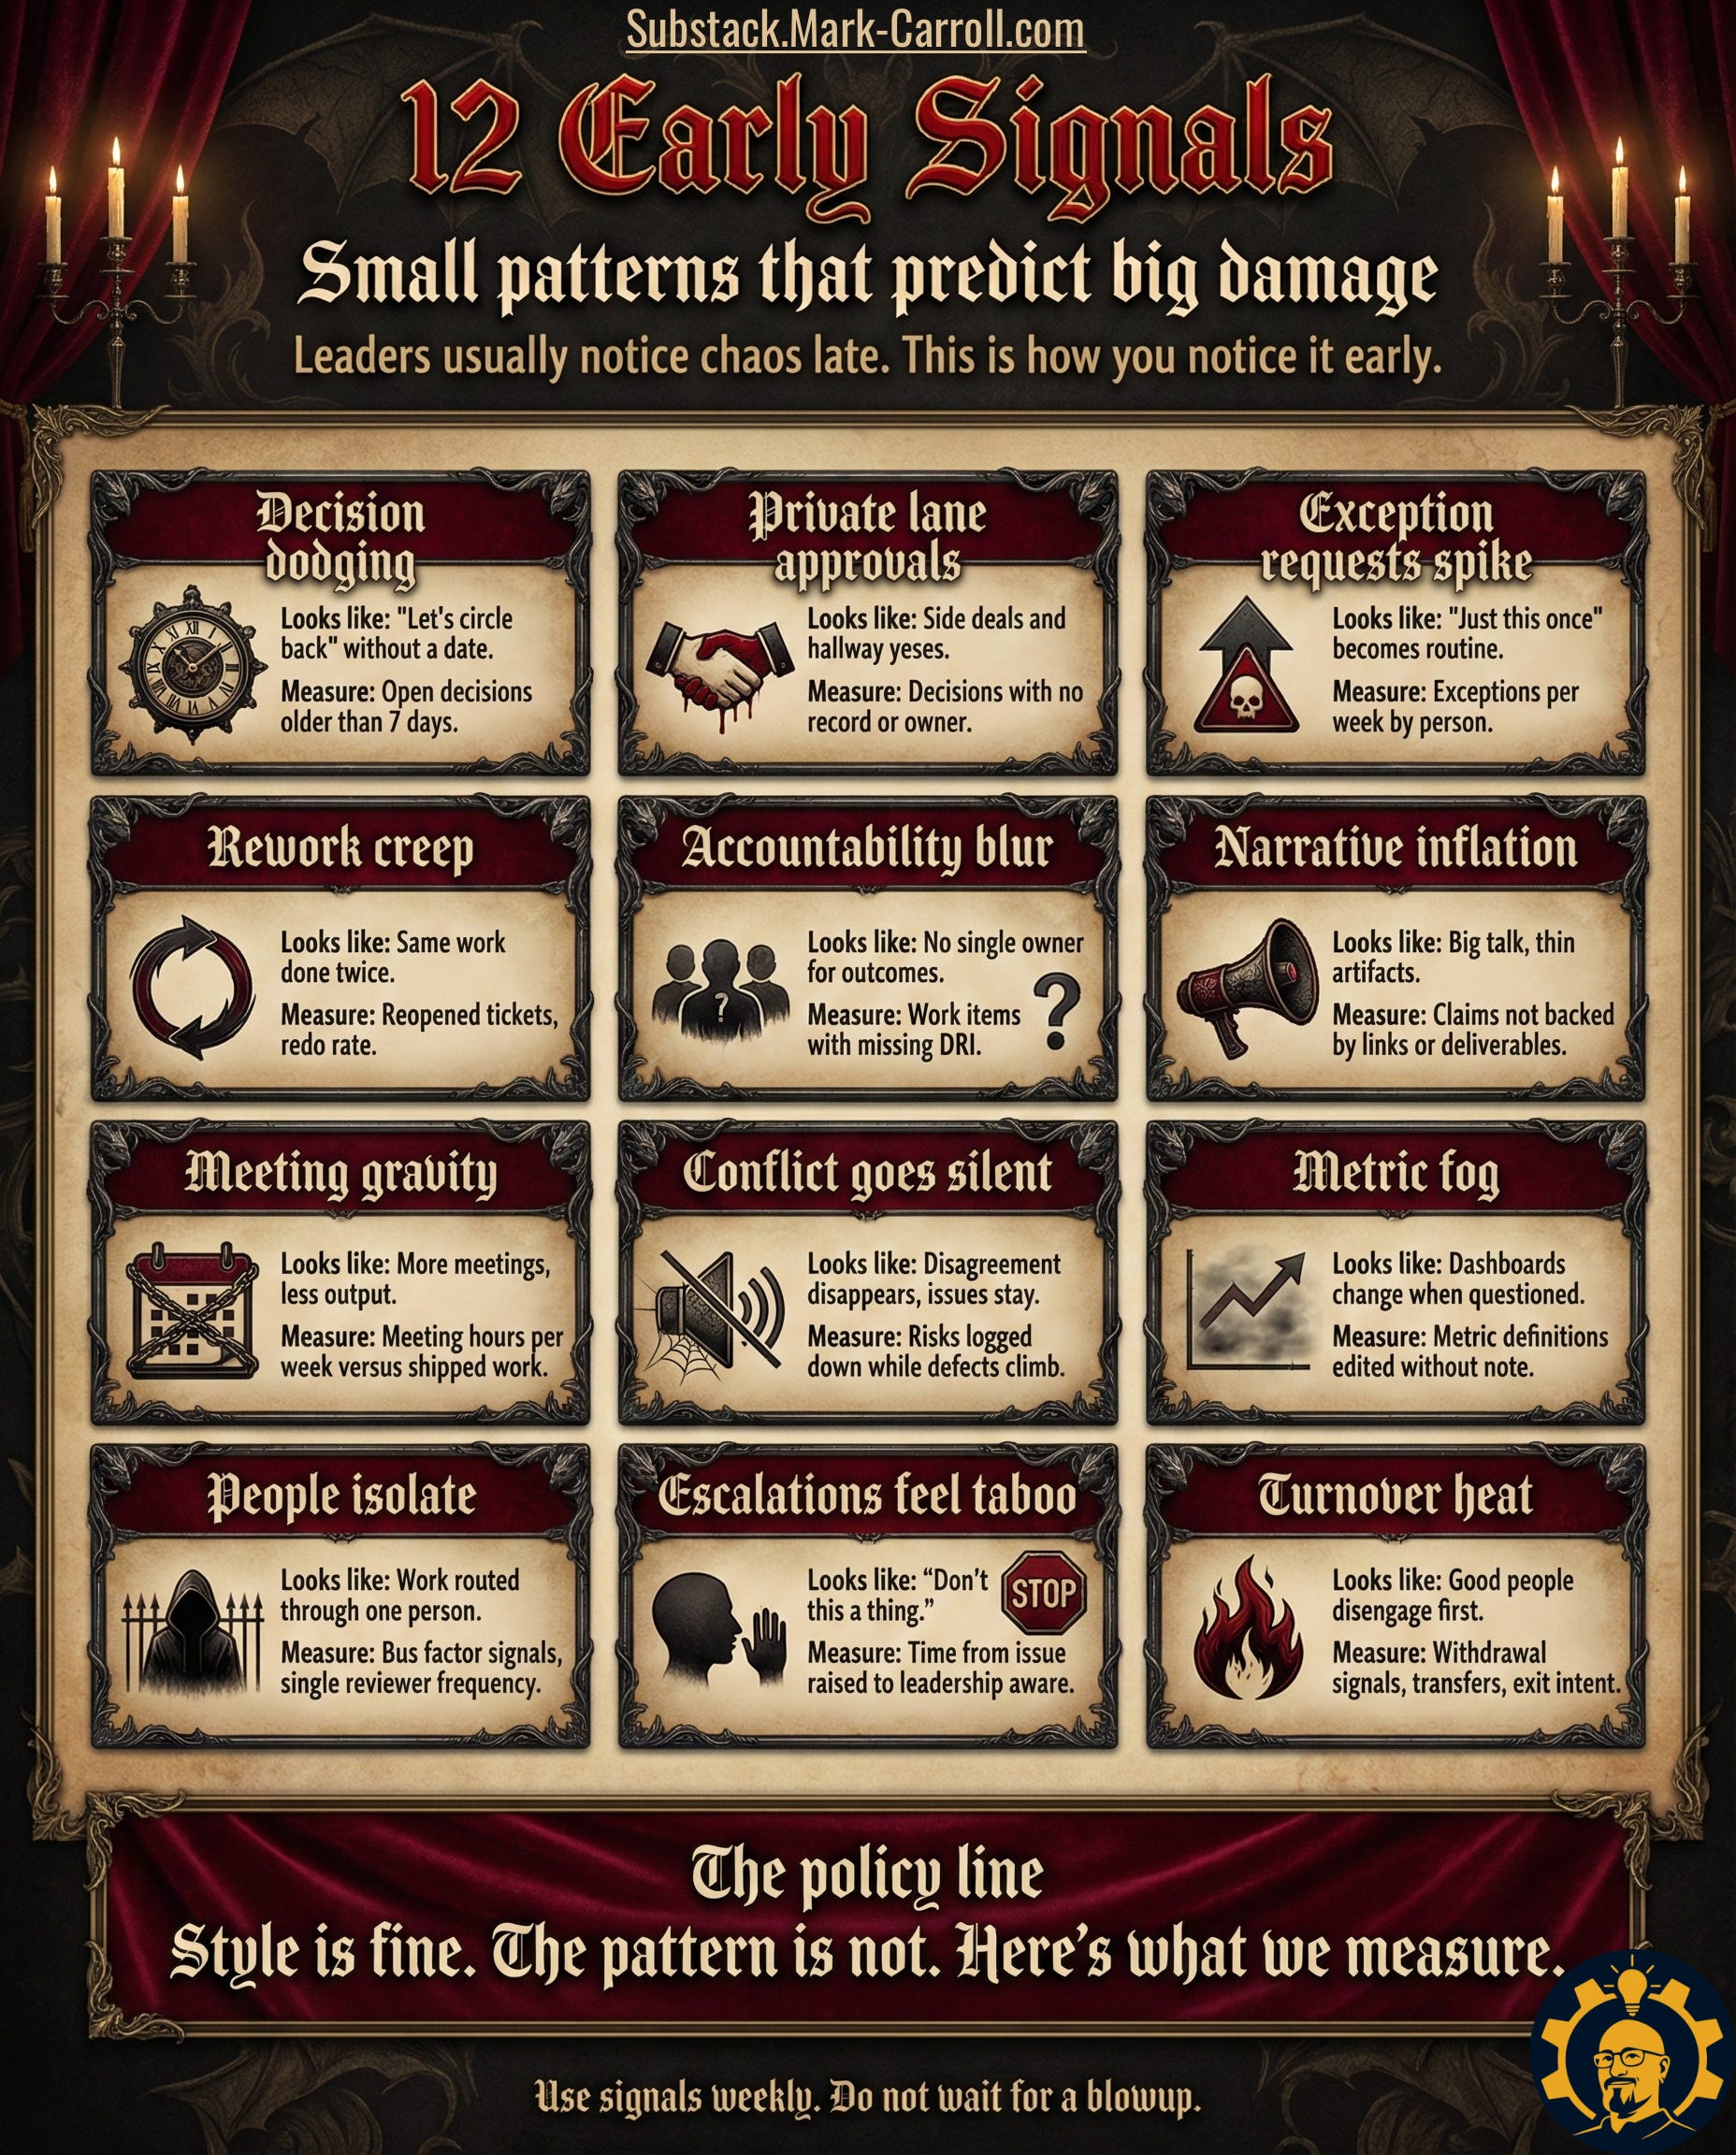
The three signals:
Signal 1: Decision dodging
What it looks like: “Let’s circle back” without a date
How to measure: Open decisions older than 7 days
Threshold: More than 5 open decisions = yellow flag
Signal 2: Private lane approvals
What it looks like: Side deals, hallway yeses, DM decisions
How to measure: Decisions with no documented owner or rationale
Threshold: More than 2 undocumented decisions per week = red flag
Signal 3: Accountability blur
What it looks like: No single owner for outcomes
How to measure: Work items missing a DRI (Directly Responsible Individual)
Threshold: Any work item without an owner after 48 hours = immediate flag
The key insight here is that decision chaos is measurable. You don’t need to debate intent or personality—just count how many decisions lack owners and records.
Zone 2: Delivery Integrity (when output breaks)
From a VP of Engineering at a B2B startup:
“Our ‘star’ engineer shipped features faster than anyone. Took us six months to realize every feature needed to be rebuilt within a quarter. The rework was invisible until we measured it. His velocity was creating negative velocity for everyone else.”
The three signals:
Signal 4: Rework creep
What it looks like: Same work done twice
How to measure: Reopened tickets, redo rate
Threshold: Reopened items exceed 10% in a two-week sprint = investigate
Signal 5: Narrative inflation
What it looks like: Big claims, thin artifacts
How to measure: Statements not backed by links, docs, or deliverables
Threshold: More than 3 unsubstantiated claims in standups per week = pattern
Signal 6: Meeting gravity
What it looks like: Meetings increase while output decreases
How to measure: Meeting hours vs. shipped work ratio
Threshold: Meeting hours up 20%+ while output flat or down = red flag
Stripe actually tracks these metrics religiously. Their “execution quality” dashboard includes rework rate as a leading indicator of technical debt and process breakdown.
Zone 3: Trust & Transparency (when truth breaks)
This is where things get subtle. A PM at Notion told me about their “dashboard incident”:
“We had someone who would update metric definitions right before reviews. Took us three months to notice the goalposts kept moving. When we finally asked about it, they got defensive and said we were ‘micromanaging.’ Classic deflection.”
The three signals:
Signal 7: Metric fog
What it looks like: Dashboards change when questioned
How to measure: Metric definitions edited without changelog notes
Threshold: Any definition change without documentation = instant flag
Signal 8: Conflict goes silent
What it looks like: Disagreements disappear but issues remain
How to measure: Risks logged trending down while defects climb
Threshold: 2-week inverse correlation = investigate
Signal 9: Escalations feel taboo
What it looks like: “Don’t make this a thing”
How to measure: Time from issue raised to leadership awareness
Threshold: Average escalation delay over 5 days = culture problem
Airbnb’s approach here is instructive. They have a “sunlight principle”—any metric change requires a written rationale and stakeholder notification. No silent edits.
Zone 4: People & Resilience (when retention breaks)
The most heartbreaking story I heard came from a startup CTO:
“We lost three senior engineers in two months. All of them said the same thing in exit interviews: ‘Everything runs through Sarah, and Sarah won’t collaborate.’ We’d made her indispensable by accident. By the time we noticed, she’d become a single point of failure AND a single point of frustration.”
The three signals:
Signal 10: Exception requests spike
What it looks like: “Just this once” becomes routine
How to measure: Exceptions granted per person per week
Threshold: More than 2 exceptions per week for the same person = dependency
Signal 11: People isolate (single threading)
What it looks like: Work routed through one person, one reviewer
How to measure: Bus factor signals, single-reviewer frequency
Threshold: One person reviewing 60%+ of PRs or tickets = bottleneck
Signal 12: Turnover heat
What it looks like: Good people disengage first
How to measure: Withdrawal patterns, transfer requests, 1-on-1 sentiment
Threshold: 2+ high performers showing exit signals = urgent
Netflix’s culture of “context, not control” specifically targets this. They track bus factor metrics and require work distribution across multiple reviewers to prevent hero culture.
The 4-step intervention system that actually works
Here’s what I learned from teams that successfully caught and contained chaos agents without drama:
They replaced subjective conversations with objective protocols.
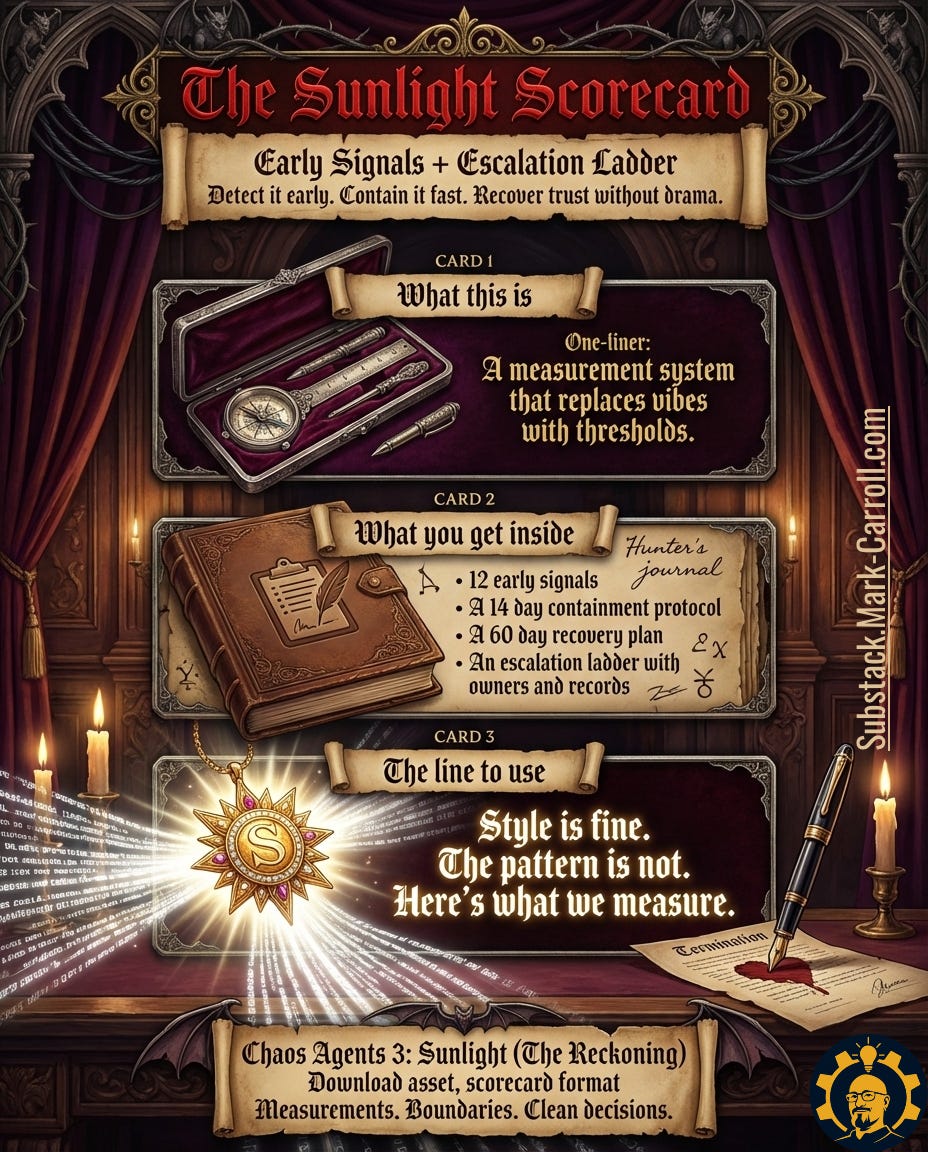
The best system I saw came from a 200-person engineering org. They call it the “Sunlight Protocol” and it has four phases.
Step 1: The 48-hour diagnosis (Days 0-2)
Action: Lock the facts before emotions take over
Start a decision log (every decision needs owner + rationale + record)
Document exceptions by person and frequency
Freeze new exception requests until review complete
Count signals across all four zones
Why this works: It shifts the conversation from “Is Alex toxic?” to “Here are 8 measurable patterns over 6 weeks.”
Step 2: The boundary sprint (Days 3-7)
Action: Set thresholds and publish them
Define what triggers escalation (the numbers from the 12 signals)
Create an escalation ladder with clear rungs
Require all approvals in writing (no more hallway decisions)
Assign owners for each signal
The magic sentence: “Style is fine. The pattern is not. Here’s what we measure.”
This line does something critical—it refuses to litigate personality or intent. It forces the conversation into observable behavior.
Step 3: Reduce blast radius (Days 8-14)
Action: Contain the damage without drama
Route work through teams, not individuals
Add backup reviewers to prevent single-threading
Shorten feedback loops (daily check-ins instead of weekly)
Track the same 12 signals to verify improvement
Non-negotiable rule from one VP: “No decision counts unless it has an owner, a rationale, and a record. Period.”
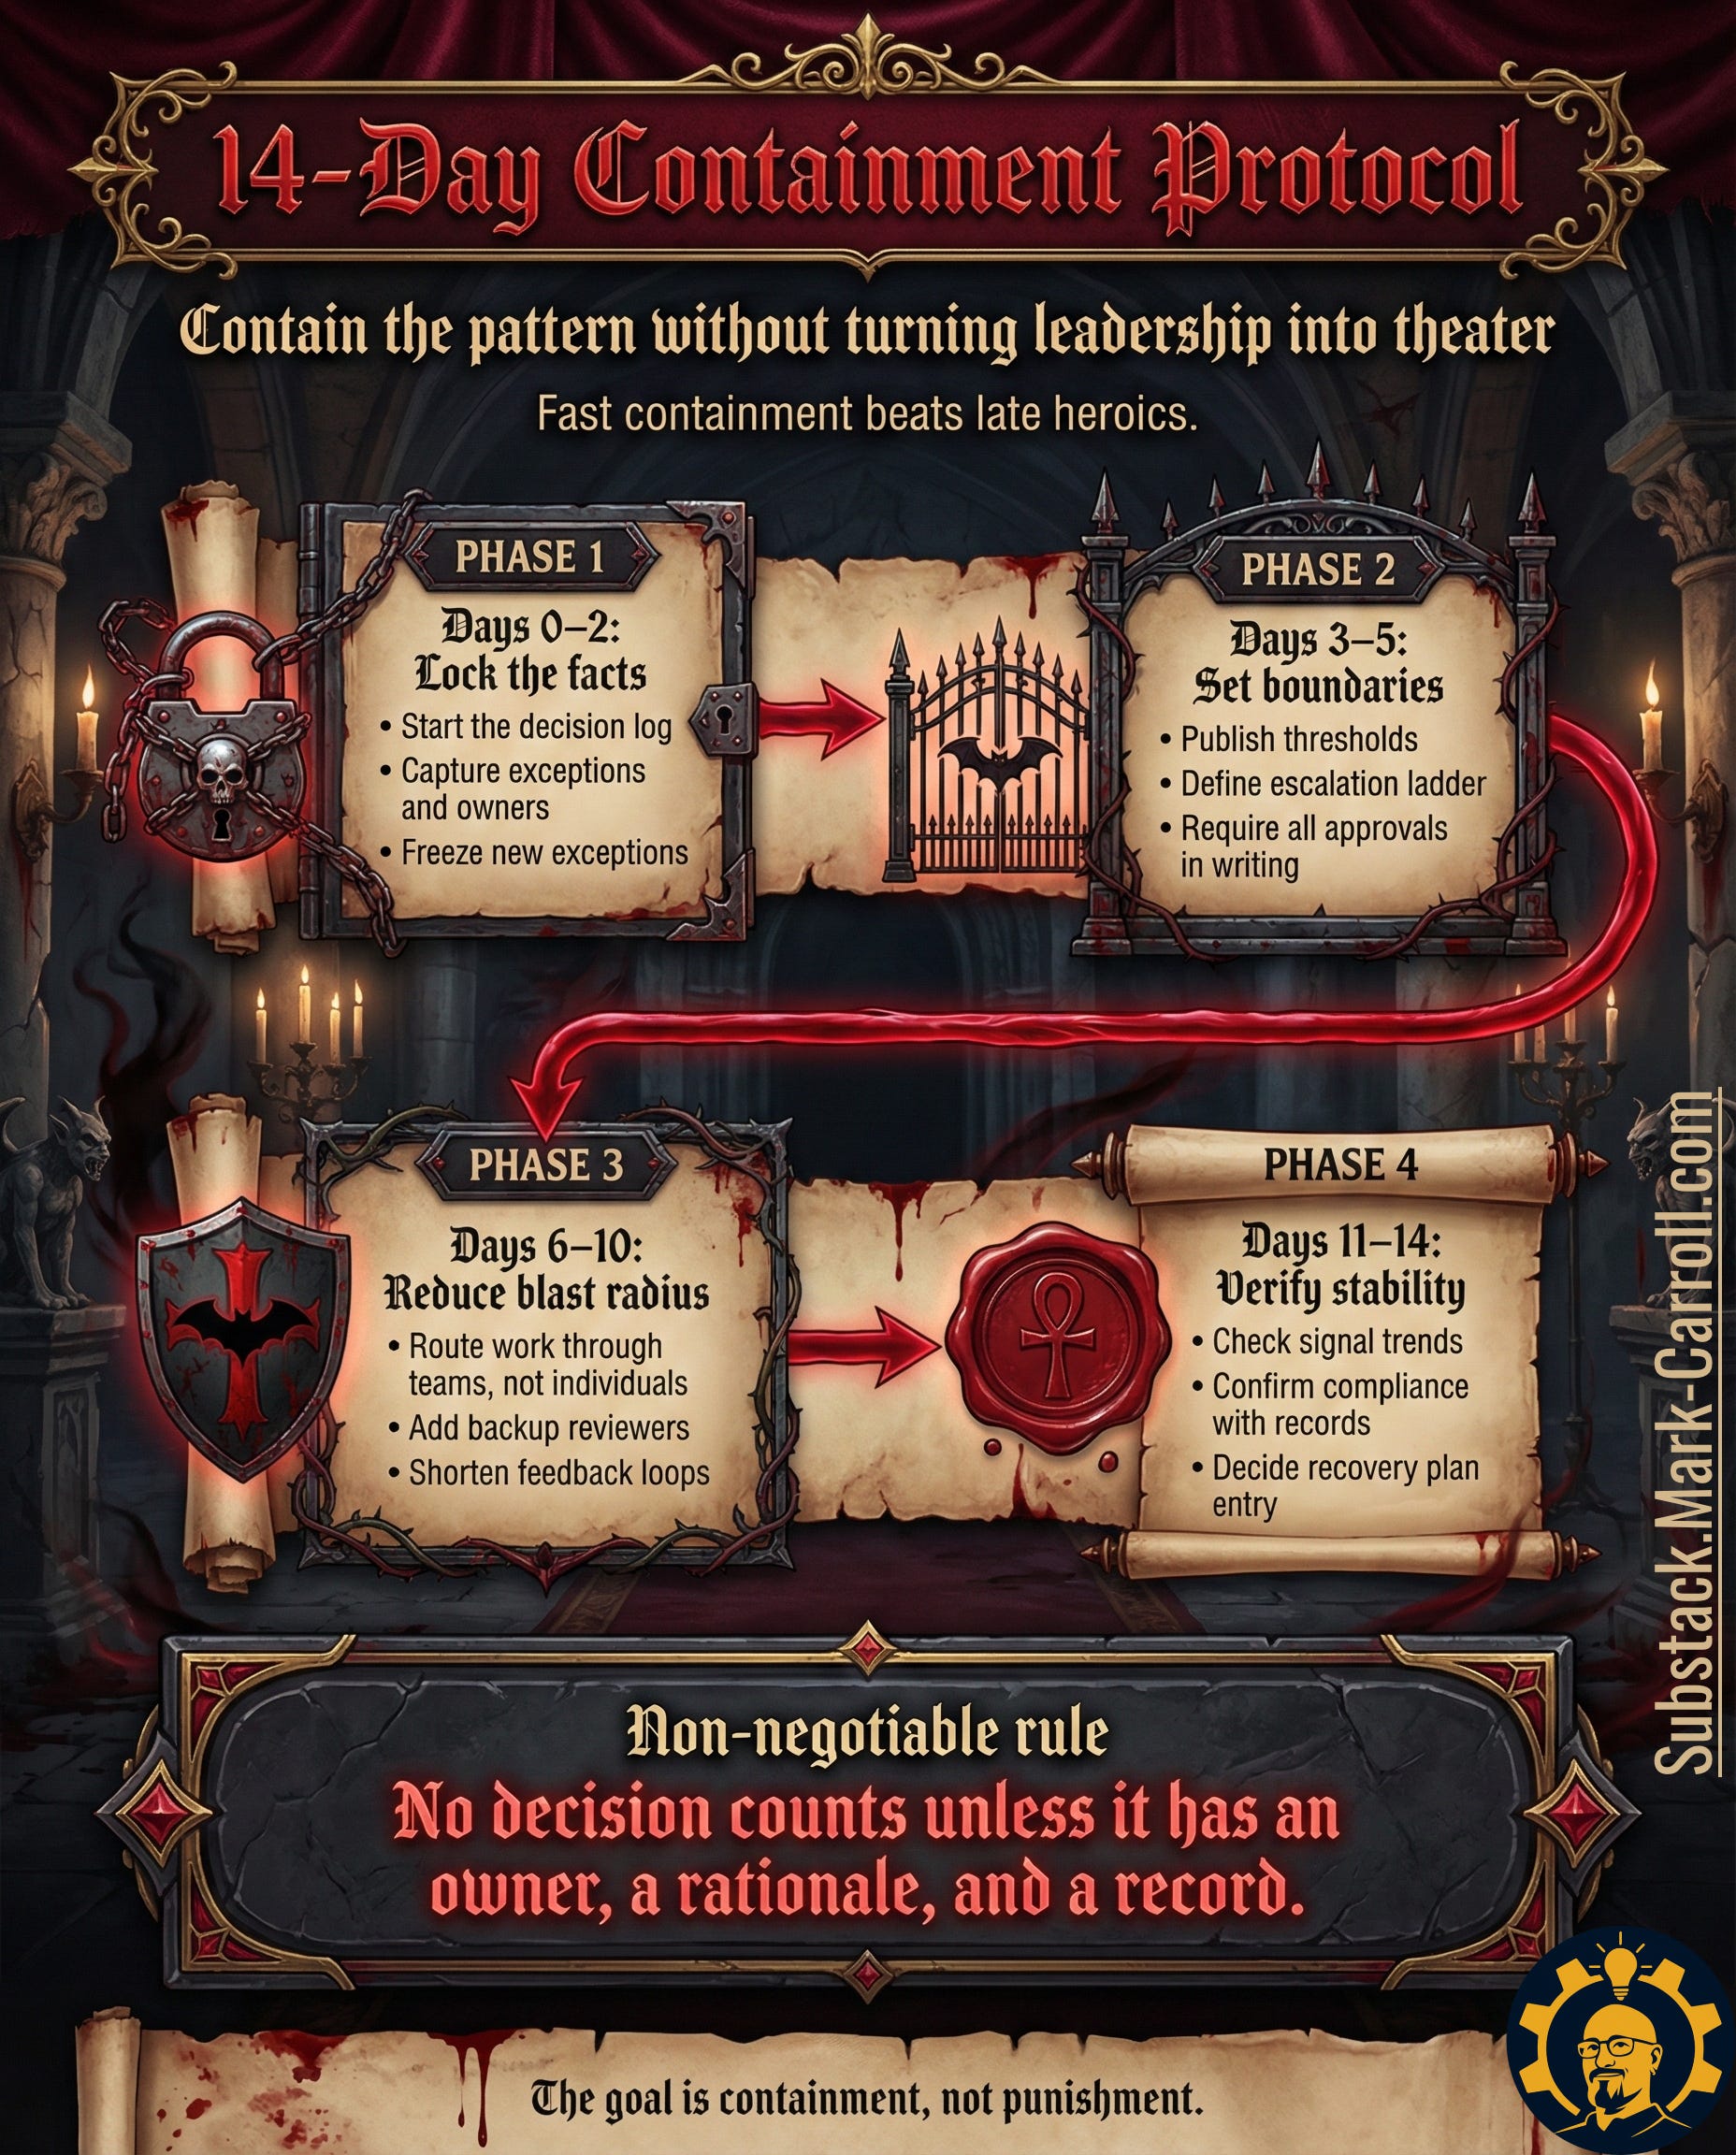
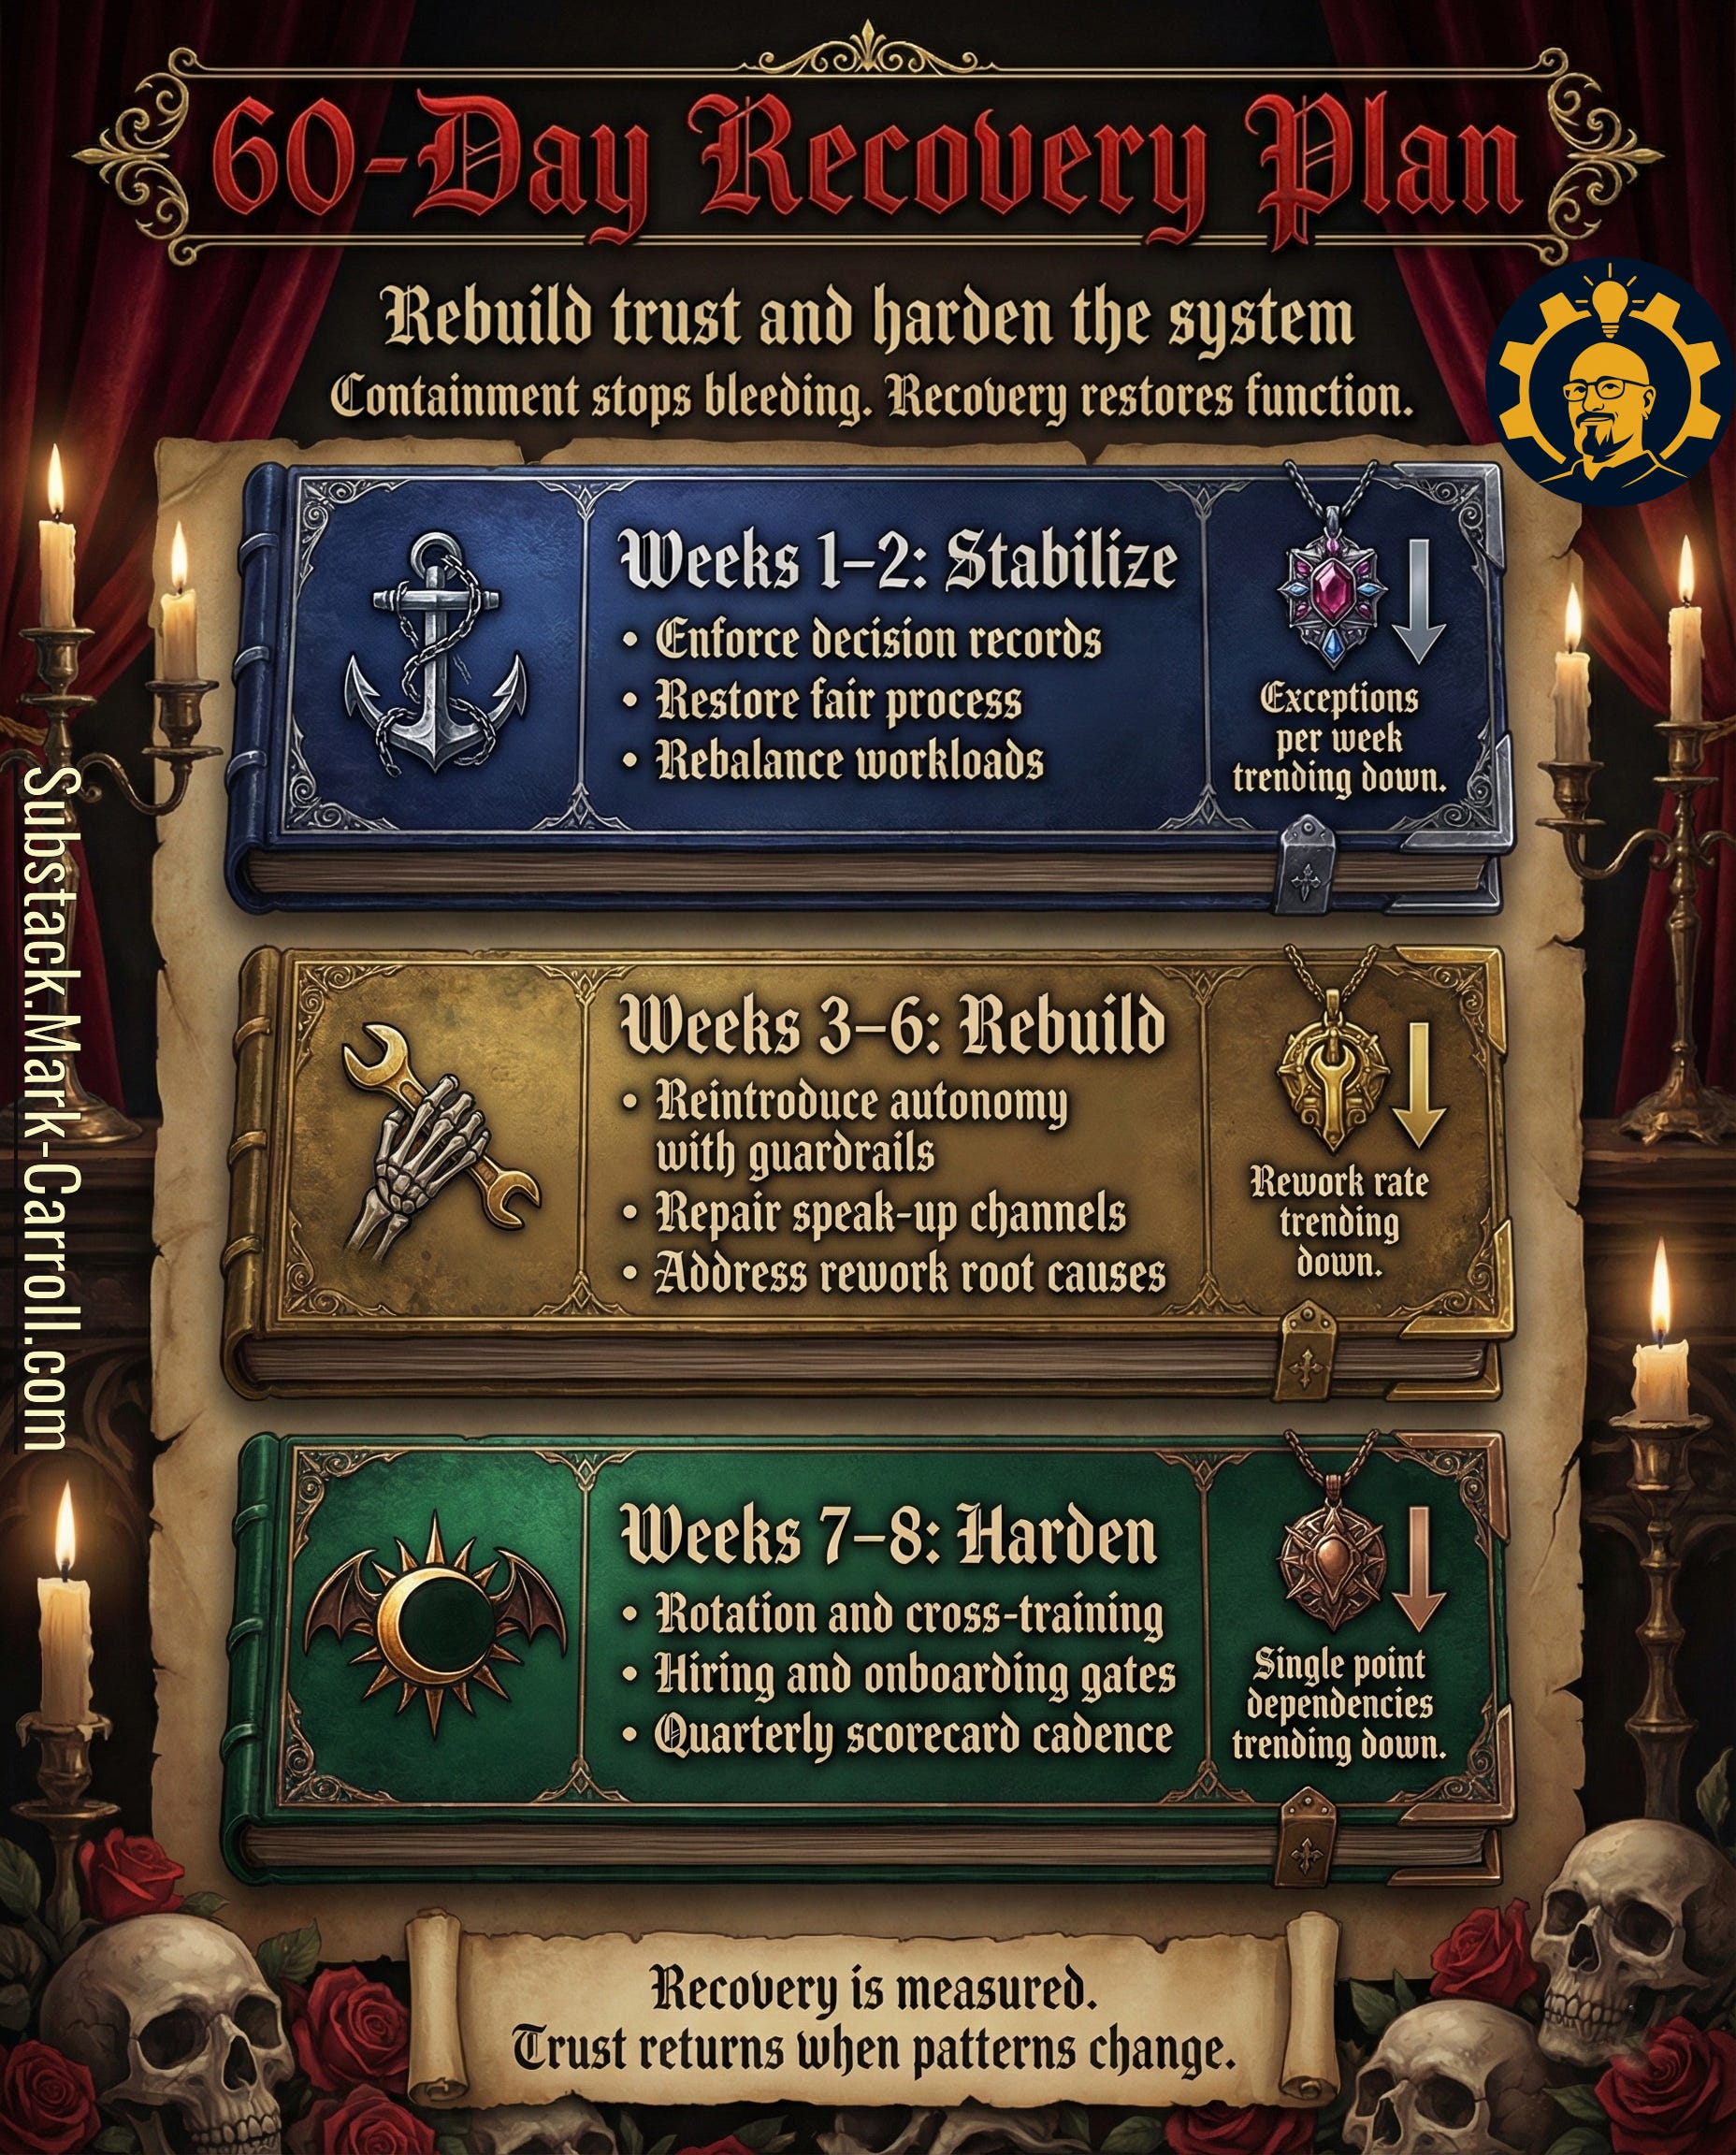
Step 4: The 60-day recovery plan
If the 14-day containment works, you move to recovery:
Weeks 1-2 (Stabilize):
Enforce decision records religiously
Restore fair process (no more exceptions)
Rebalance workloads away from single points
Success metric: Exception requests trending down
Weeks 3-6 (Rebuild):
Reintroduce autonomy with clear guardrails
Repair speak-up channels (anonymous feedback, skip-levels)
Address root causes of rework
Success metric: Rework rate trending down
Weeks 7-8 (Harden):
Implement rotation and cross-training
Update hiring/onboarding to screen for collaboration
Lock in quarterly scorecard reviews
Success metric: Single-point dependencies trending down
The key insight: Trust returns when patterns change, not when speeches get better.
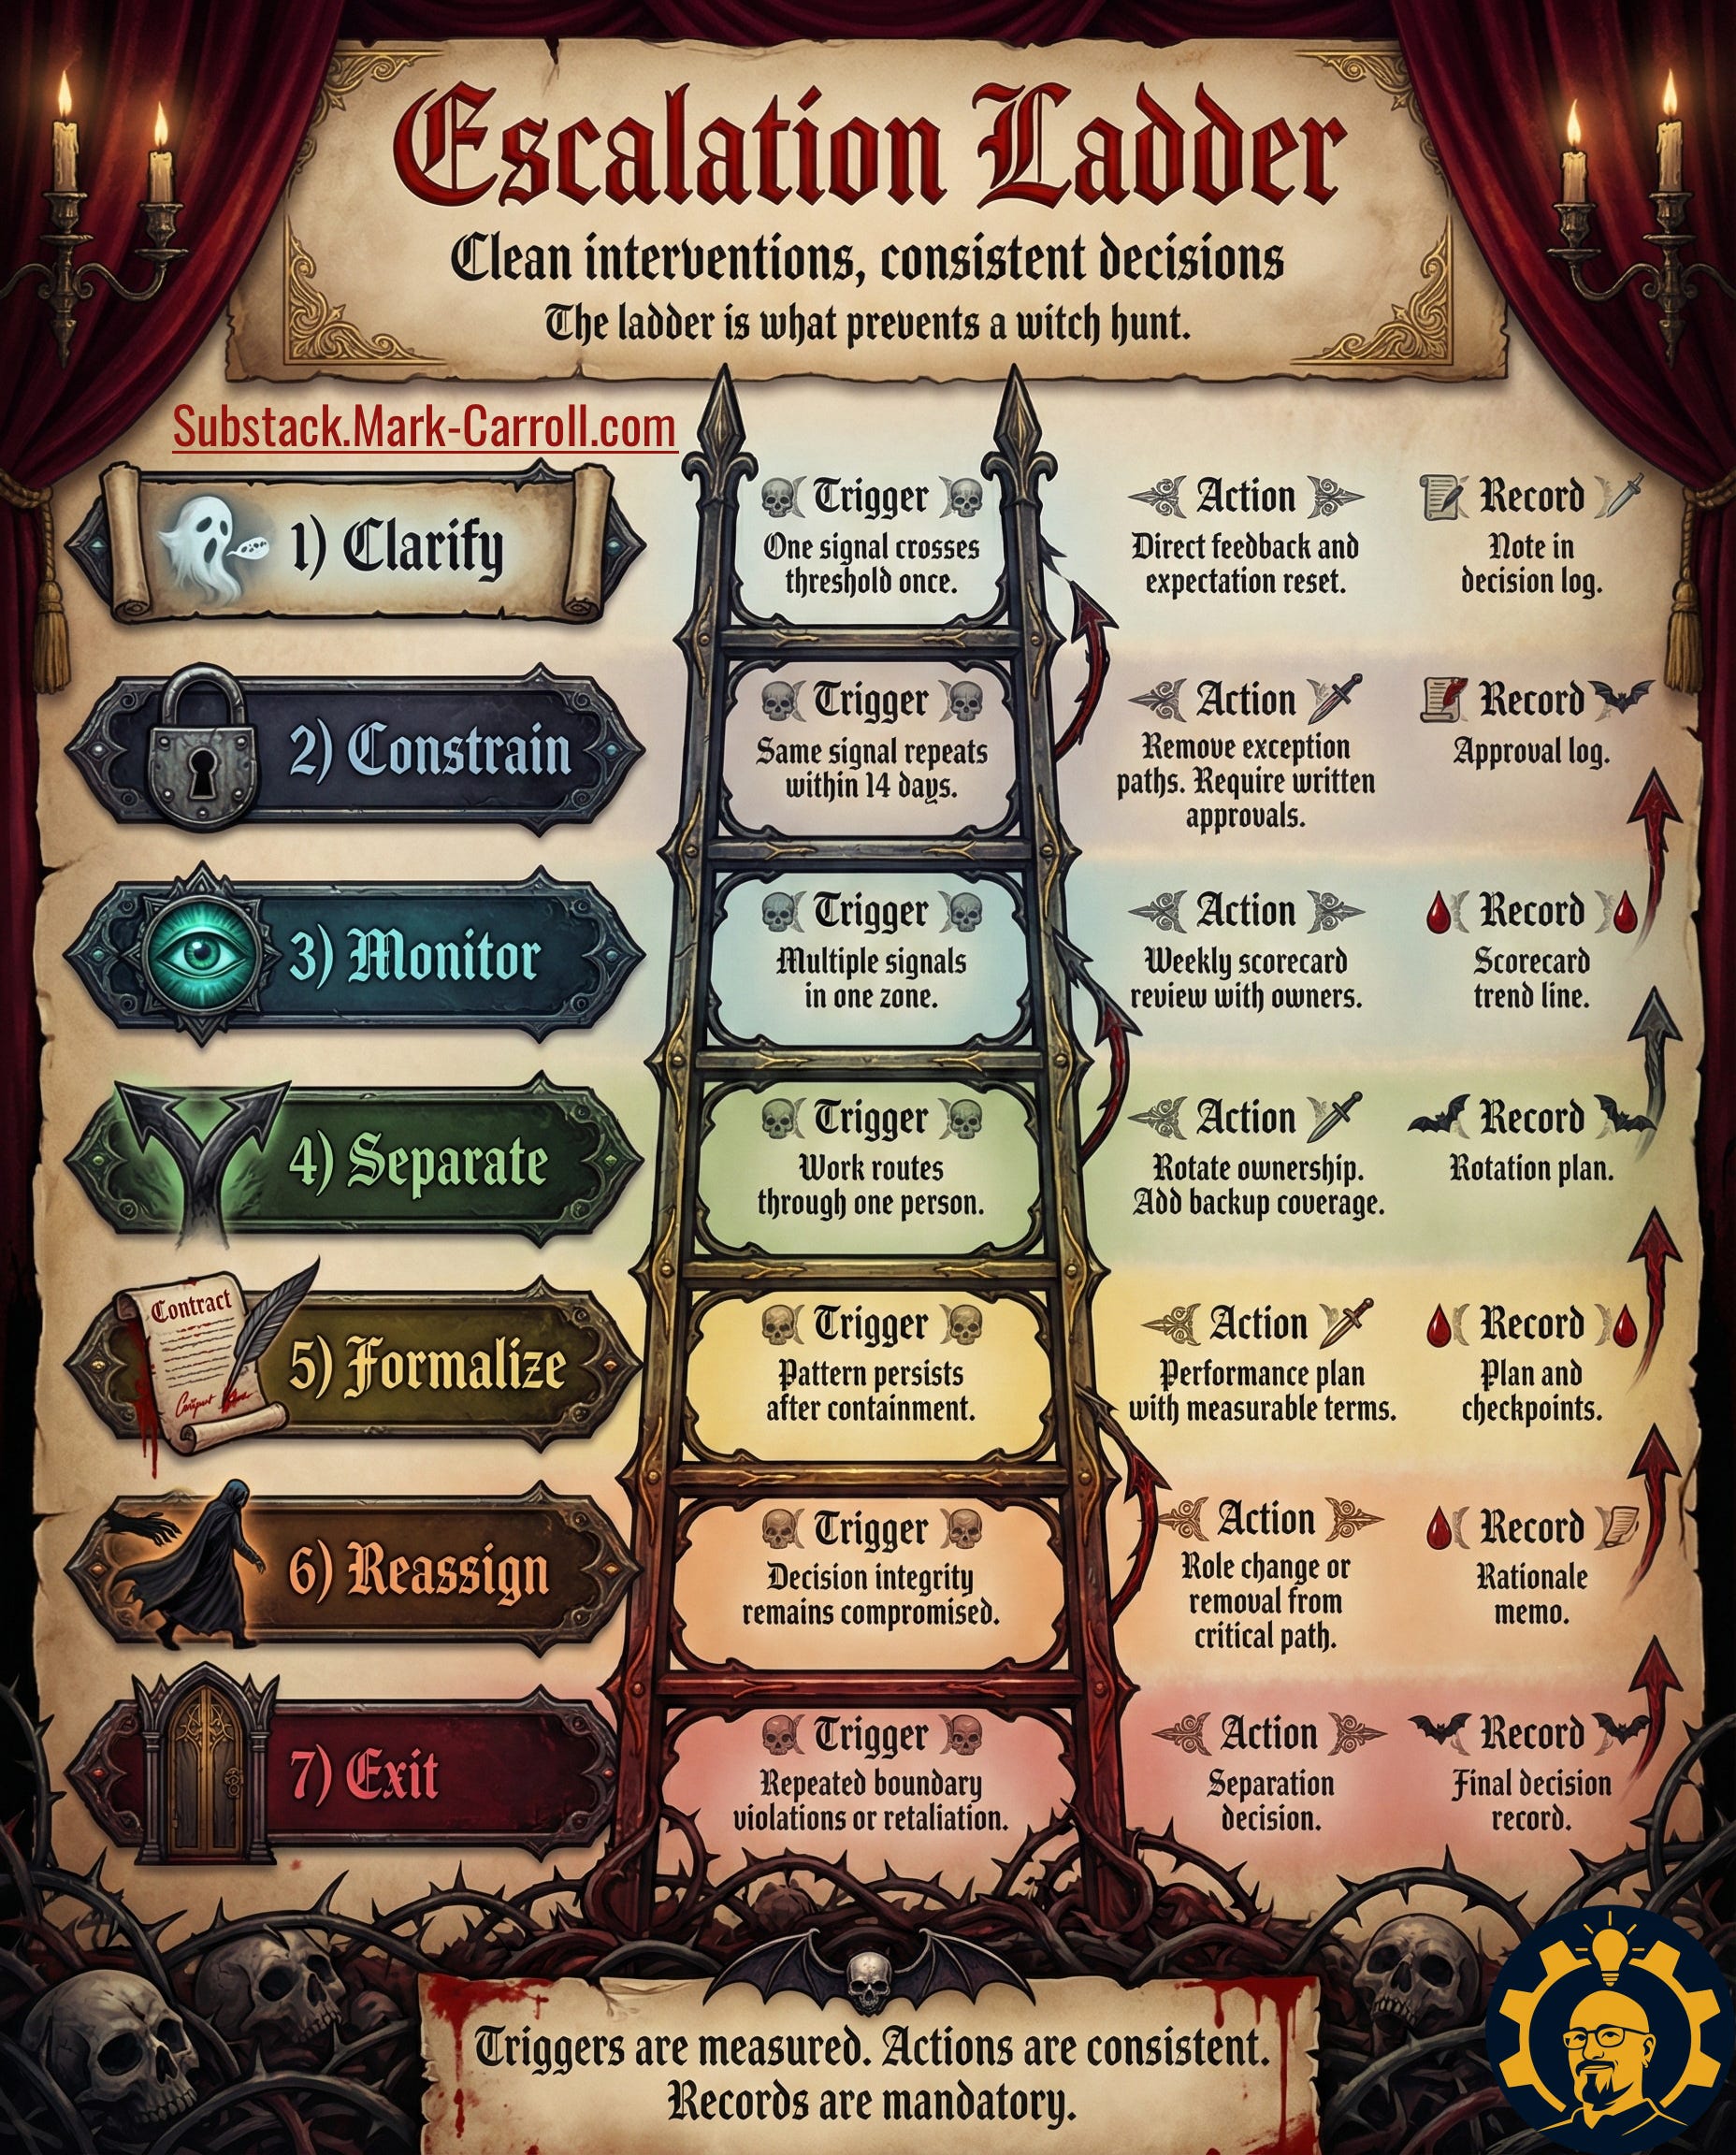
The escalation ladder that prevents witch hunts
One of my biggest concerns going into this research was: “Doesn’t this just create a surveillance state?”
The answer I heard from every leader: No, because the ladder protects everyone.
Here’s the 7-rung system that balances accountability with fairness:
Rung 1: Clarify
Trigger: First threshold breach
Action: 1-on-1 conversation with concrete examples
Record: Written summary, no formal file
Rung 2: Constrain
Trigger: Second breach within 30 days
Action: Temporary guardrails (required approvals, mandatory reviews)
Record: Documented in performance file
Rung 3: Monitor
Trigger: Third breach or pattern across zones
Action: Weekly check-ins, restricted autonomy
Record: Formal monitoring plan
Rung 4: Separate
Trigger: Continued pattern despite monitoring
Action: Reassign collaborators, reduce scope
Record: HR involvement begins
Rung 5: Formalize
Trigger: No improvement after separation
Action: Performance improvement plan (PIP)
Record: Legal documentation
Rung 6: Reassign
Trigger: PIP not met or new zone failures
Action: Role change, team change, or scope reduction
Record: Full documentation
Rung 7: Exit
Trigger: Continued failure or severe single incident
Action: Managed departure
Record: Complete paper trail
What makes this work: Every rung has a measured trigger, a defined action, and a mandatory record. No leader discretion. No selective enforcement.
As one director told me: “The ladder protects the individual from arbitrary punishment and protects the team from arbitrary tolerance. Everyone knows the rules.”