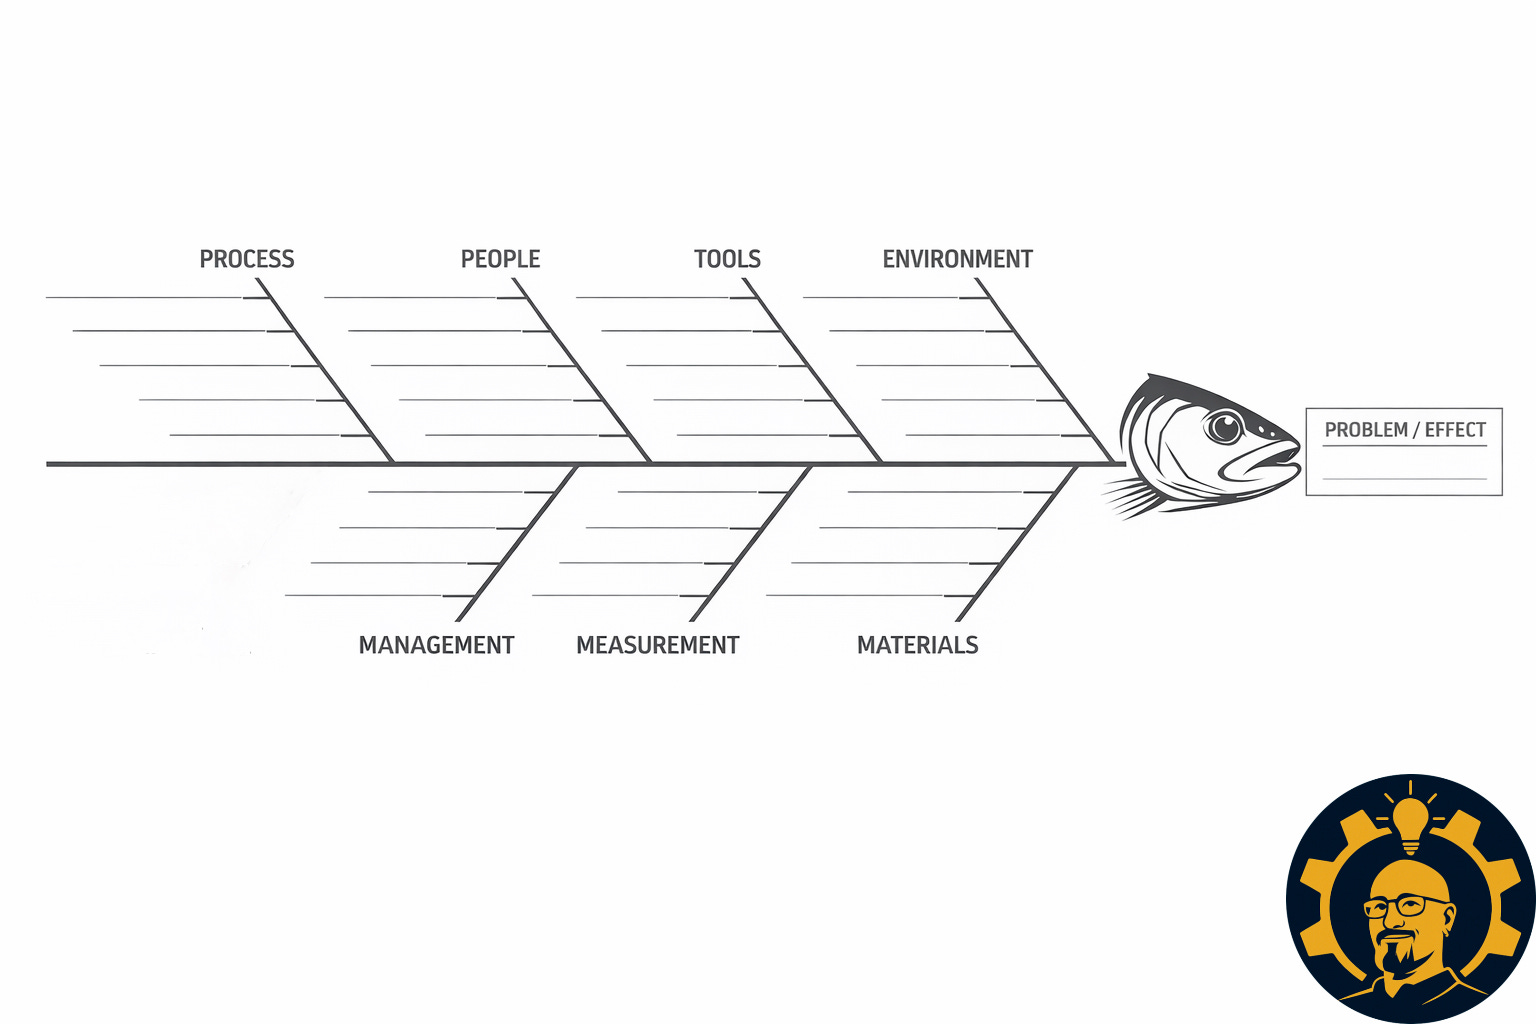
The Fishbone Diagram (also called a Cause-and-Effect diagram or an Ishikawa Diagram) is a simple, visual way to get past surface symptoms and map the real drivers of a problem. “Ishikawa” comes from Kaoru Ishikawa, the quality-management thinker who popularized this method for analyzing root causes, especially in manufacturing and process improvement. You write the problem statement at the “head” of the fish, then brainstorm possible causes along the “bones,” grouping them into categories so patterns become obvious fast.
This download includes two versions:
Blank template so your team can build the structure that fits your reality.
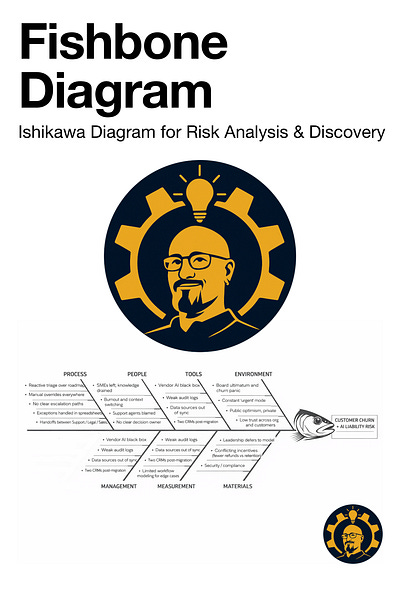
Example template with starter branches for Process, People, Tools, Environment, Management, Measurement, and Material. Those branches are placed in consistent positions for readability, not as a commandment. Use them, rename them, delete them, or add your own.

Cause & Effect Fishbone Diagram
136KB ∙ PDF file
The Fishbone Diagram (also called a Cause-and-Effect or Ishikawa Diagram) is a fast, visual way to move past symptoms and map the real drivers of a problem. Put the problem statement at the “head” of the fish, then brainstorm potential causes along the “bones,” grouped into categories so patterns show up quickly. The method is named for Kaoru Ishikawa, who popularized it in quality management and process improvement.
This download includes two PDFs:
Blank template to match your team’s reality
Example template with starter branches (Process, People, Tools, Environment, Management, Measurement, Material). Use them as defaults, not commandments. Rename, remove, or add categories as needed.
Quick start: define the problem clearly, brainstorm causes one idea per note, ask what evidence would confirm each cause, then select the most likely root causes and turn them into experiments or fixes.
Bonus: a simple SWOT chart sits at the bottom of the download for teams that want it, though a whiteboard and sticky notes usually win on speed.
Download
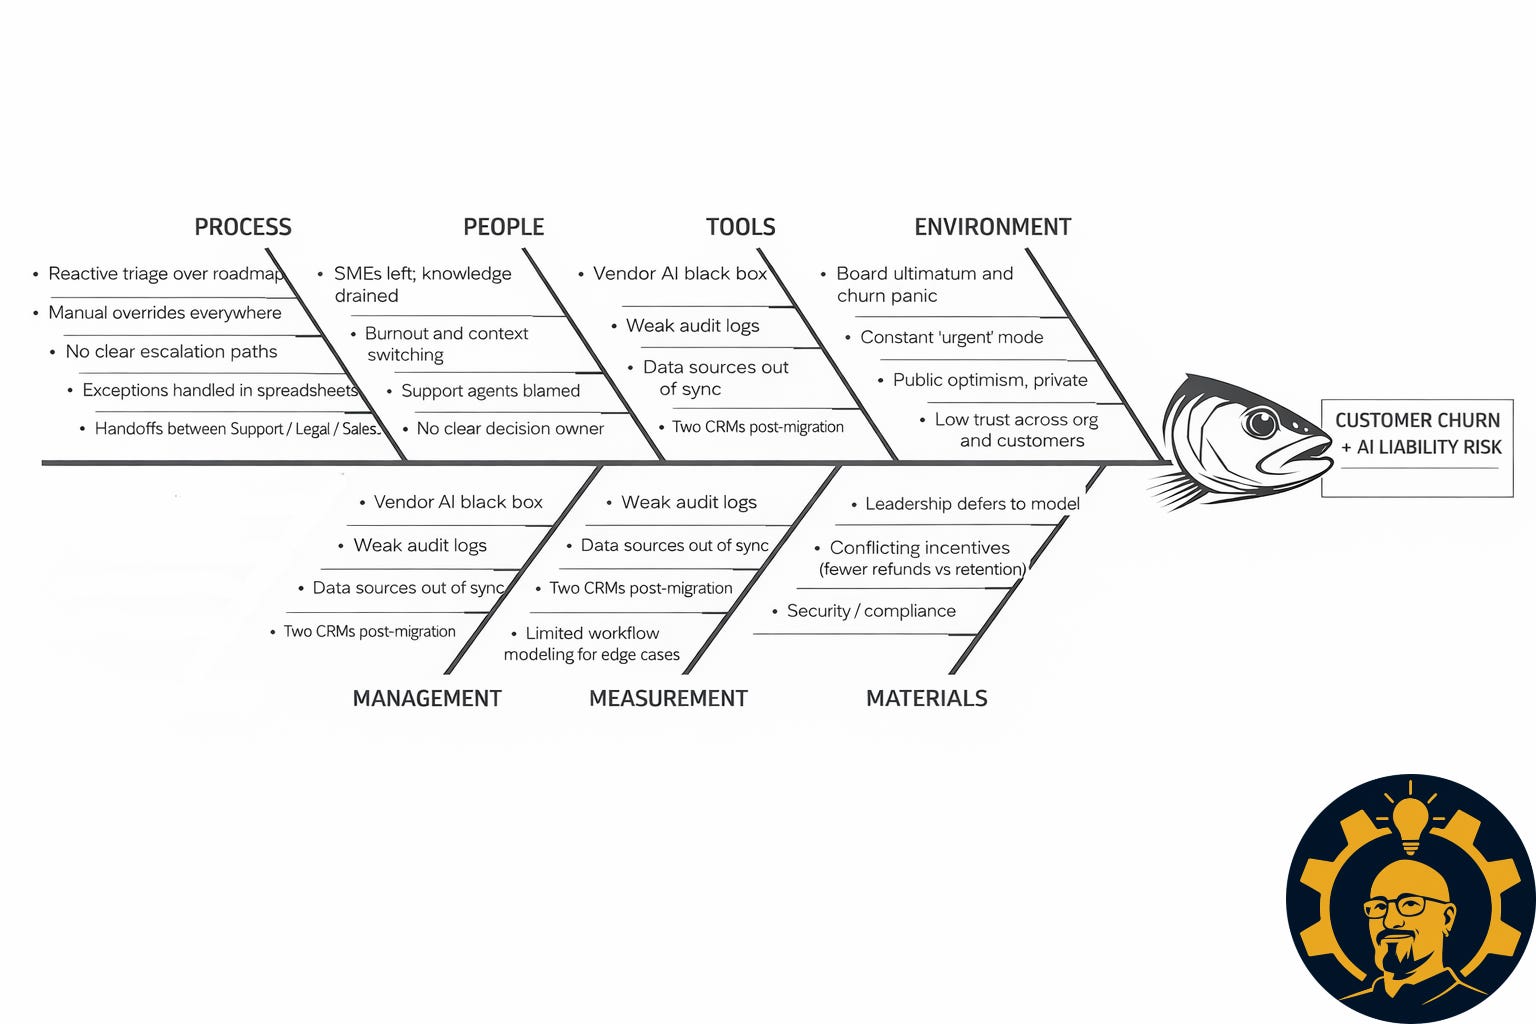
Cause & Effect Simplified Example
238KB ∙ PDF file
To start a Fishbone, your team only needs two things: a clear problem statement and a few starter branches that match how your work actually happens.
Begin by writing the problem at the head of the fish in plain, observable language. For example: “Customer onboarding takes 14+ days and produces frequent rework.” Then add 5–7 main branches as your first pass. If you use the classic starters (Process, People, Tools, Environment, Management, Measurement, Material), treat them like training wheels. Keep what fits, rename what doesn’t, add what’s missing.
Now fill only the first layer on each branch. Aim for a handful of “cause categories,” not a thousand sticky notes.
Process: Where do handoffs stall, approvals pile up, or steps get repeated? (Example: “Requirements change after sign-off,” “Intake is inconsistent.”)
People: Where are skills, roles, coverage, or decision rights unclear? (Example: “No single owner,” “Training varies by team.”)
Tools:What systems slow the work, hide information, or create duplicate entry? (Example: “Data lives in three places,” “No template for intake.”)
Environment: What external conditions make the problem worse? (Example: “Interrupt-driven support,” “Multiple time zones.”)
Management: What incentives, policies, or priorities push behavior in the wrong direction? (Example: “Everything is urgent,” “Escalations skip the queue.”)
Measurement: What is not being tracked, or being tracked in a way that distorts behavior? (Example: “Cycle time not visible,” “Success defined differently by each role.”)
Material (or Inputs): What inputs arrive incomplete, late, or inconsistent? (Example: “Missing customer data,” “Upstream work not standardized.”)
Once each branch has a few first-layer notes, pause and ask: “Which branch feels loudest, and which notes can we actually prove?” Mark the items you can validate with evidence (logs, tickets, timestamps, customer feedback), then dig deeper only on the most likely causes by adding second-layer bones. That’s how you keep the diagram from becoming a museum of complaints and turn it into a launchpad for fixes.
Download
Quick start
Write a clear problem statement (specific, observable, and time-bound if possible).
Brainstorm causes onto the bones, one sticky-note idea at a time.
Ask “What evidence would confirm this?” and mark the causes you can validate.
Pick the most likely root causes and turn them into experiments or fixes.
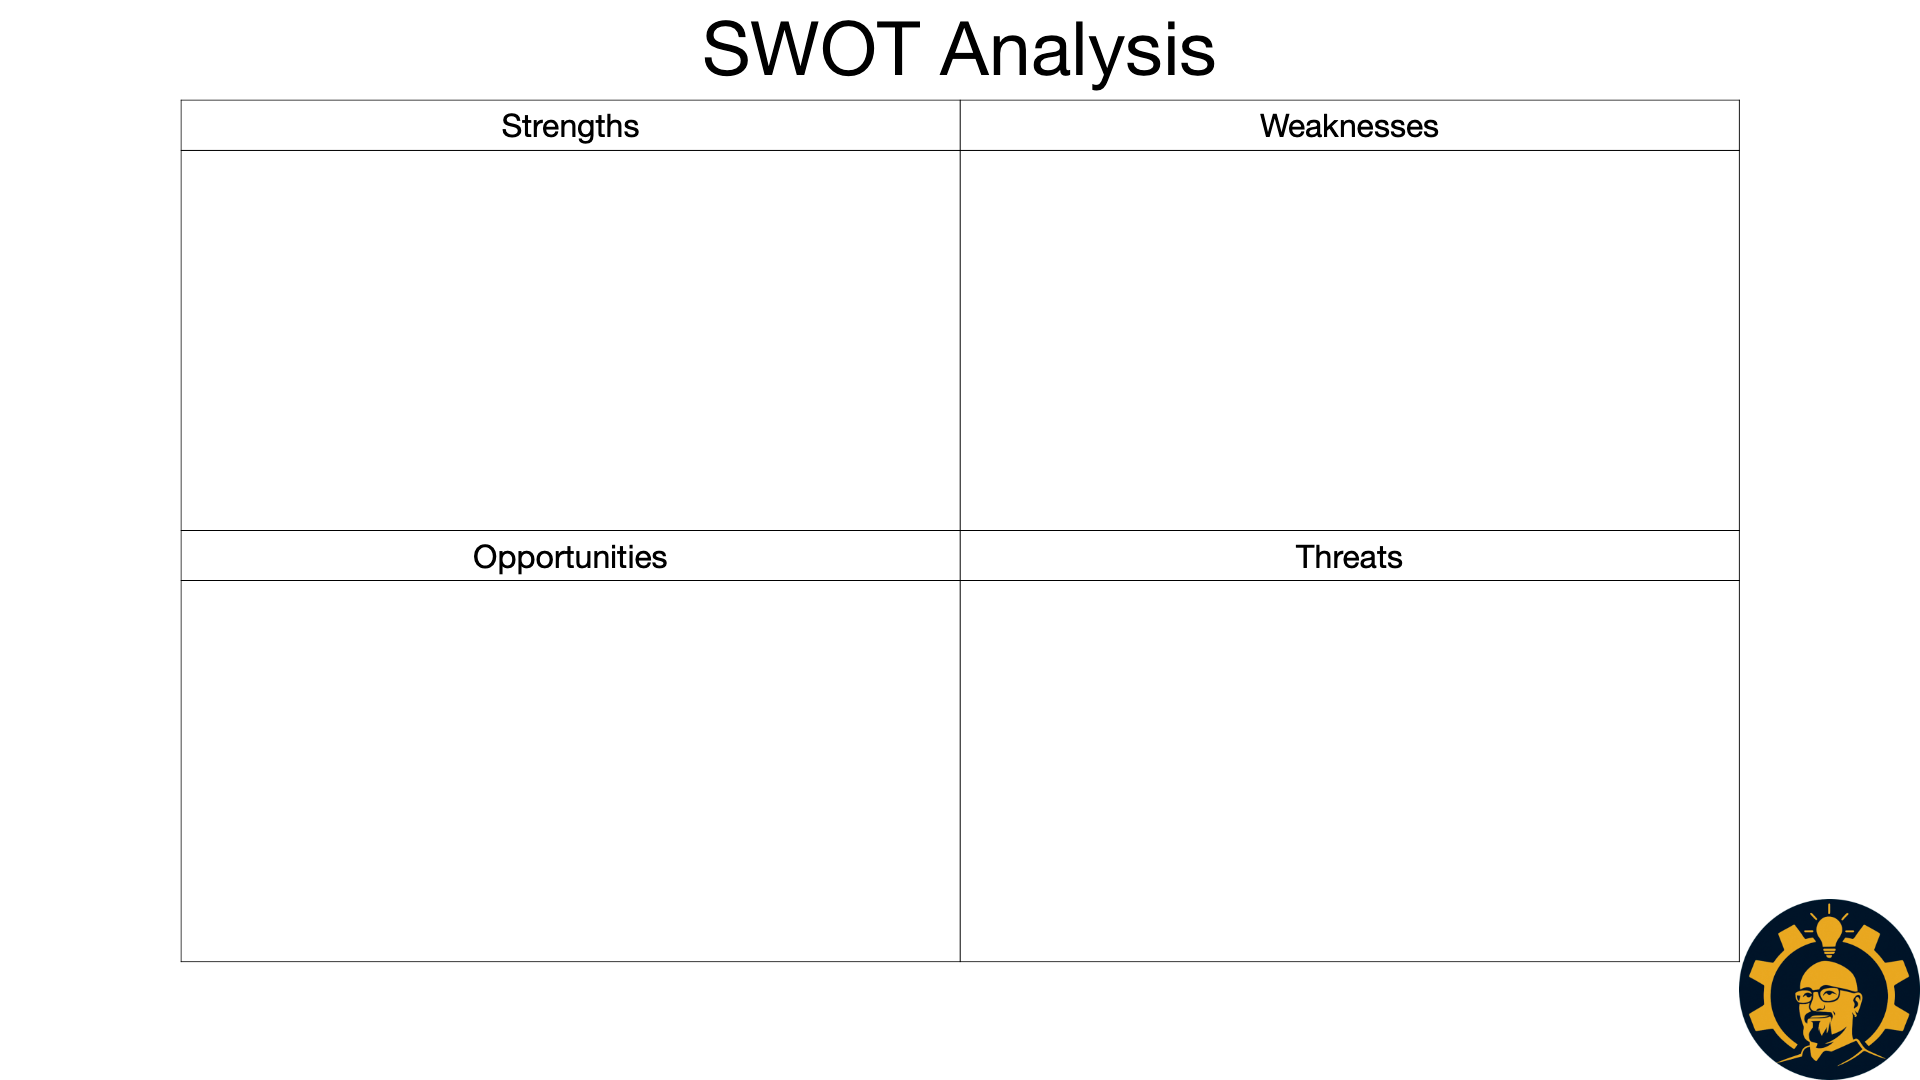
Side note: At the very bottom of the download, there’s also a simple SWOT analysis chart. Most teams do not need a printable version. A whiteboard, sticky notes, or whatever’s closest and convenient is usually the best tool for the job.
A SWOT Analysis is a simple first move toward risk analysis because it helps a team name what is true before debating what is scary.
Start by putting your topic in the center (project, product, team, change effort), then do a quick, time-boxed first pass in four buckets:
Strengths (internal advantages): What’s working, reliable, or uniquely strong right now?
Weaknesses (internal constraints): Where are we fragile, slow, inconsistent, or dependent on heroics?
Opportunities (external upsides): What tailwinds, openings, or bets could pay off soon?
Threats (external risks): What could derail us: competitors, regulation, vendor instability, changing needs, budget pressure?
Keep each item short and specific, one per sticky note. Then do the “risk bridge” step: circle the Weaknesses and Threats that could most damage outcomes, and write one sentence for each: “If ___ happens, we might ___.” That gives you a starter list of risks your team can rank, assign owners to, and turn into mitigations.
Download