Cuellar-Carroll Canvas
Lean Canvases Made Easy, More Interactive, and Strategically Relevant

First Drafted in Early 2016

Welcome to the Lean Canvas Facilitation Pack
Why this canvas exists
A lot of canvases look harmless. Then you put one on a screen in a conference room and suddenly it feels like you just invited everyone to watch you do math out loud.
Because it is not just a template. It is a moment.
The person who approves your raise is sitting three chairs away.
Somebody who would love your role is taking mental notes.
You are trying to name the goal while also pretending you totally already had the goal.
That is the trap. The blank canvas does not create clarity. It creates performance anxiety.
The Cuellar-Carroll Canvas was designed to lower the temperature. It is built for teams who need to start from scratch without getting punished for not having perfect language on the first try. It gives you structure, but it does not force you into corporate poetry. You can put real things on the board, the kind people actually deal with, and then move forward step by step.
Whether you are leading a shift, running a product, coaching an Agile team, or trying to get a room of stakeholders pointed in one direction, this canvas is meant to help you translate a messy situation into an actionable plan.
And it is not just a framework. It carries a belief that matters in facilitation and in life.
The strongest outcomes are not the ones you lecture people into. They are the ones a group uncovers together, then commits to because it feels like theirs.
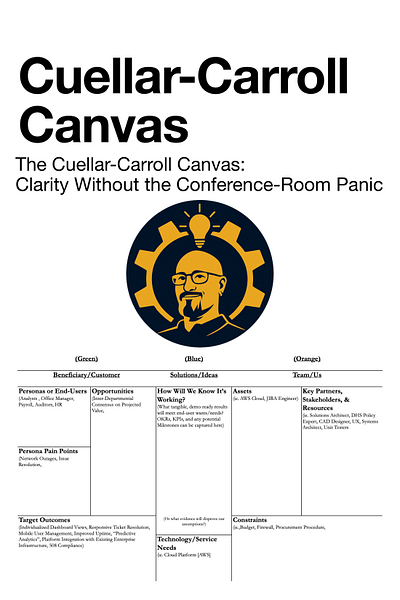
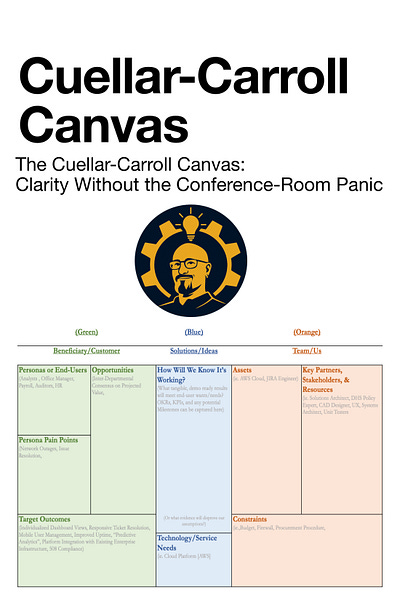
The Cuellar-Carroll Canvas Is An Actionable Artifact (Explained in three color zones)
Green: Who we serve and what “better” means
People we serve (buyers, users, and everyone affected)
List the groups that matter. Current customers, future customers, internal users, and the folks downstream who live with the outcome. One card per group.
Near-term improvements
Write down practical upgrades you could make soon. These can be rough. You are capturing possibilities, not carving commandments into stone.
Pain points
What slows them down, frustrates them, or costs them time, money, or trust. Keep each pain point separate so you can sort them later.
Longer-term wins
What does “success” look like when things are truly working. These tend to be clearer and more durable than quick fixes.
Insight
Today’s quick wins often point toward tomorrow’s bigger finish line. Use the quick wins to learn what the real destination should be.
Orange: What we have to work with
What’s already in our toolbox
Skills, experience, equipment, systems, and know-how that exist right now.
Who can help and what we can pull in
Other teams, vendors, stakeholders, shared services, budget paths, and internal allies you can realistically tap.
Reality checks
Anything that limits options. Safety requirements, regulatory constraints, union rules, procurement rules, security policies, legal guardrails. Not to kill creativity, but to keep you from designing unicorns when you need a forklift.
Insight
Toolbox is what you already control. Helpers and resources are what you can access. Guardrails keep the plan doable.
Blue: The bridge between needs and delivery
What “good” looks like (measures of success)
If your metrics already exist, capture them one per card. If they do not, start with plain language that the floor can verify.
Manufacturing-plant example: “The line runs a full shift without jams.”
That is a real success statement. Everyone knows what it means. Then later you can translate it into numbers like jam count per shift, downtime minutes, scrap rate, or schedule attainment.
If you need a place to park “we are currently bleeding here” indicators, use the bottom strip for things like: “Jam stops per shift” or “Unplanned downtime minutes.”
What we are missing
Tools, services, parts, training, maintenance support, data access, or technical help you need to make the bridge real. One gap per card.
Insight
Start with a sentence people can picture. Convert it into metrics after the team agrees what a good day feels like.
Move 3: Group the cards into themes
Once the canvas is filled with cards, start sorting similar items into piles. This is where patterns show up.
A simple way to run it:
Sort silently for a few minutes. No speeches, just clustering.
Label each cluster with a short theme.
Identify the clusters that matter most, or that cause the most headaches.
Use those clusters to drive next decisions and next experiments.
The PDF in this post is the downloadable pack. Use it to run a session this week.
If you want the full facilitation guide behind this canvas, including variations for different team sizes and ways to translate the cards into next steps, it is in Collaborate Better.
https://CollaborateBetter.us
If this was useful, consider sharing it with someone who is about to walk into a meeting with a blank template and a room full of opinions. You might save them from doing math out loud.
Plain White Version (Alternate):